


Crude Oil Stocks Change of Trend or Just a Correction?
Commodities / Oil Companies May 20, 2014 - 10:35 AM GMTBy: Nadia_Simmons

 In the previous week, crude oil moved higher after pro-Russian separatists in eastern Ukraine voted in favor of self rule in a weekend referendum. These circumstances fueled fears that the conflict may escalate further and trigger more sanctions against Russia, affecting Russian oil shipments. At this point, it’s worth noting that worries over this issue have kept oil prices above the level of $100 in recent weeks. Nevertheless, although the U.S. and the European Union imposed two rounds of sanctions, they didn’t disrupt shipments from Russia. The situation, however, deteriorated slightly as the EU expanded sanctions (targeting two Crimean companies and 13 people to aim at corporations rather than individuals) last Monday. In reaction to this news, Russia reiterated that it could cut off Kiev's natural gas supplies and informed the EU in the following days that it would stop natural-gas deliveries to Ukraine on June 1 unless it receives payments for past-due amounts. Ukraine said it is preparing to pay $4 billion to Gazprom but hopes to negotiate lower prices.
Although these events fueled worries about the potential supply interruptions from the region and pushed light crude above $102 on Friday, oil stocks didn’t follow this increase. Instead, they declined to slightly above the psychological barrier of 1,600. Will the XOI rebound from here in the near term? What is the current technical picture of oil stocks?
Let’s begin with the long-term chart (charts courtesy by http://stockcharts.com).
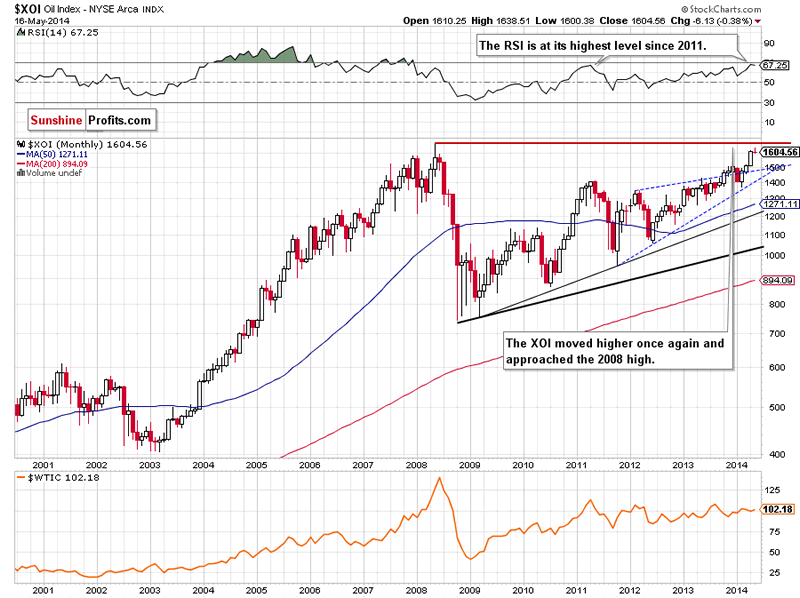
From this perspective, we see that the situation has improved significantly as the XOI extended gains and successfully broke above the psychological barrier of 1,600 in the previous month. This strong bullish signal triggered further improvement and the oil stock index climbed above 1,630, hitting a fresh 2014 high of 1,638. At this point, it’s worth noting that the RSI reached its highest level since 2011. Although the indicator is not overbought, it seems to us that such high reading in combination with the proximity to the 2008 high of 1,663 may pause further improvement in the coming month.
To see the current situation more clearly, let’s zoom in on our picture and move on to the weekly chart.
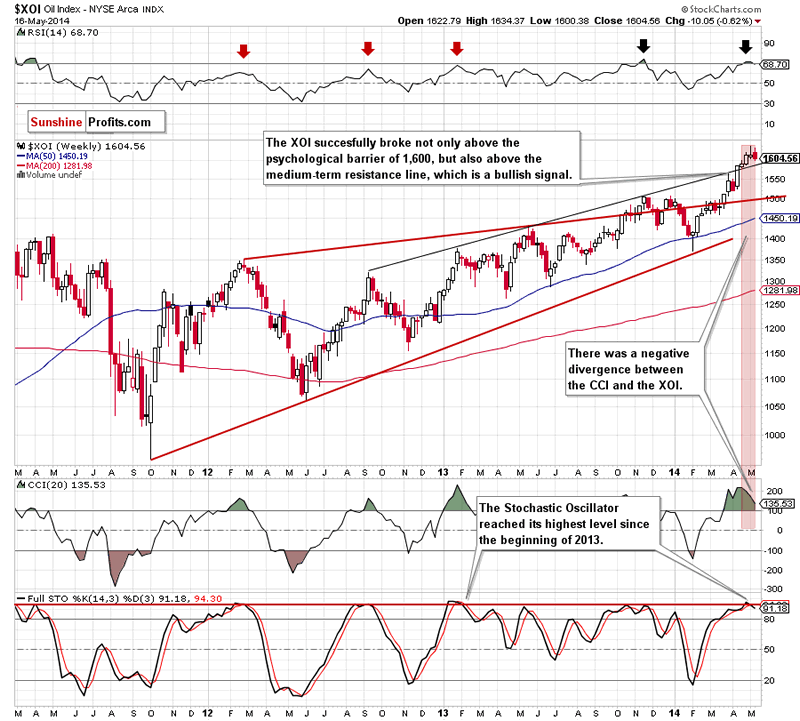
As you see on the above chart, the XOI successfully broke above the medium-term resistance line (based on the Sept. 2012, Jan. 2013 and May 2013 highs) in the recent weeks. This strong bullish signal encouraged oil investors to push the buy button, which resulted in an increase above the next psychological barrier of 1,600. As we mentioned earlier, the breakout fueled further improvement and the XOI hit a fresh 2014 high of 1,638.
Although we don’t see any important technical resistance levels that could stop rally in oil stocks, the position of the indicators suggests that the situation is not as bullish as it seems at the first glance. As you see on the weekly chart, there was a negative divergence between the CCI and the XOI at the end of April and also at the beginning of May. Additionally, at the turn of April and May, the Stochastic Oscillator reached its highest level since the beginning of 2013, while the RSI broke above the level of 70. In the previous years (for example, in Sept. 2012, Jan. 2013 and also in Nov. 2013) similar circumstances predicted the trend reversal. Will history repeat itself once again?
Although the XOI reversed and declined to the psychological barrier of 1,600 in the previous week, it still remains above the previously-broken medium-term black line (which serves as support around 1,590 at the moment). Therefore, we think that as long as these important lines remain in play, the space for further declines is limited. However, if the CCI generates a sell signal and Stochastic Oscillator drops below the level of 80, it seems to us that the selling pressure will increase, which may resulted in a breakdown below the above-mentioned support lines and trigger a bigger correction in the following weeks. If this is the case, we think that oil stocks may decline even to around 1,536, where the 38.2% Fibonacci retracement based on the entire Feb.-May rally is.
Having discussed the medium-term outlook, let’s turn to the daily chart.
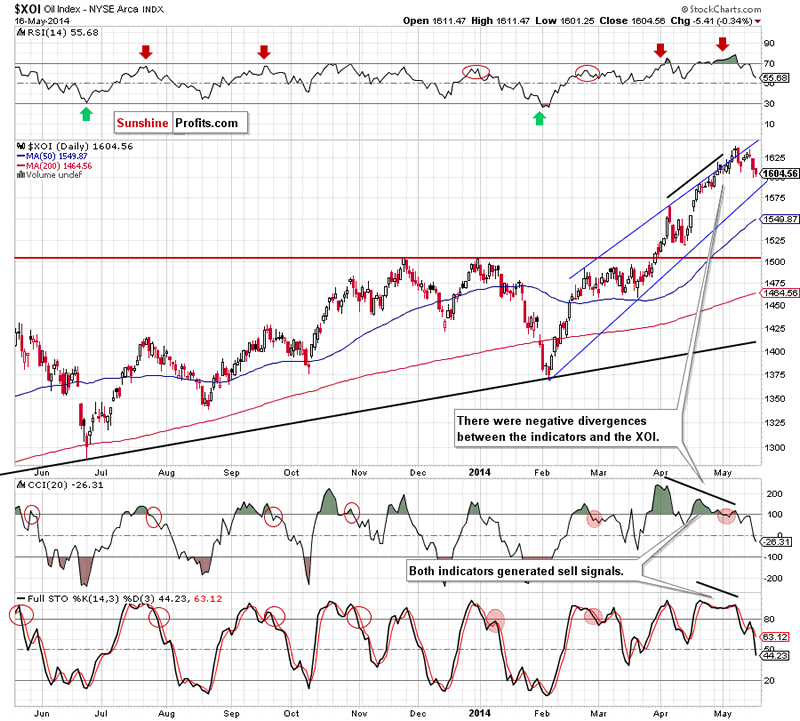
As we mentioned earlier, the XOI extended gains and successfully broke above the psychological barrier of 1,600, hitting a fresh 2014 high at the end of April. From this perspective, we see that with this upward move, the oil stock index reached the upper line of the rising trend channel, which decelerated further improvement at the beginning of May. Although, the oil stocks index bounced off this major resistance and climbed to a new annual high of 1,638, this improvement was only temporarily and the XOI reversed, declining below the upper blue line.
At this point, some of you may ask: but why? The answer is quite simple - the position of the indicators. At that time, the RSI climbed to its highest level since the beginning of the April. Back then, even lower value of the indicator triggered a correction in the XOI (we saw similar situations in October, November and also in December ). Additionally, the CCI and Stochastic Oscillator were overbought, and there were negative divergences between them and the oil stocks index. Such bearish circumstances suggested that a correction was just around the corner. Therefore, when indicators generated sell signals, the situation has deteriorated and the XOI declined to its nearest support – the psychological barrier of 1,600. What’s next?
On one hand, if it holds, we will see a corrective upswing to around 1,623. However, if it is broken, the next downside target for oil bears will be around 1,590, where the lower border of the blue rising trend channel is.
Summing up, from the medium- and short-term perspectives, the situation has deteriorated slightly as the oil stocks index reversed and declined to the key level of 1,600. As we have pointed out before, we think that as long as the XOI remains above this important support level and the medium-term black line (which corresponds to the lower border of the blue rising trend channel and serves as support around 1,590 at the moment), the space for further declines is limited. Nevertheless, please keep in mind that the position of the medium- and short-term indicators suggests that further deterioration is just around the corner, which should raise the attention of oil stocks holders.
The above is based on the part of this month’s Oil Investment Update, in which we deal with the major factors influencing the price of crude oil and oil stocks, including the analysis of little-known yet important ratios.
Thank you.
Nadia Simmons
Sunshine Profits‘ Contributing Author
Oil Investment Updates
Oil Trading Alerts
* * * * *
Disclaimer
All essays, research and information found above represent analyses and opinions of Nadia Simmons and Sunshine Profits' associates only. As such, it may prove wrong and be a subject to change without notice. Opinions and analyses were based on data available to authors of respective essays at the time of writing. Although the information provided above is based on careful research and sources that are believed to be accurate, Nadia Simmons and his associates do not guarantee the accuracy or thoroughness of the data or information reported. The opinions published above are neither an offer nor a recommendation to purchase or sell any securities. Nadia Simmons is not a Registered Securities Advisor. By reading Nadia Simmons’ reports you fully agree that he will not be held responsible or liable for any decisions you make regarding any information provided in these reports. Investing, trading and speculation in any financial markets may involve high risk of loss. Nadia Simmons, Sunshine Profits' employees and affiliates as well as members of their families may have a short or long position in any securities, including those mentioned in any of the reports or essays, and may make additional purchases and/or sales of those securities without notice.
© 2005-2022 http://www.MarketOracle.co.uk - The Market Oracle is a FREE Daily Financial Markets Analysis & Forecasting online publication.