


Stock Market Approaching A Short-Term Top
Stock-Markets / Stock Markets 2014 Jun 02, 2014 - 11:03 AM GMTBy: Andre_Gratian

 Current Position of the Market
SPX: Very Long-term trend - The very-long-term cycles are in their down phases, and if they make their lows when expected, there will be another steep decline into late 2014. However, the Fed policy of keeping interest rates low has severely curtailed the full downward pressure potential of the 40-yr and 120-yr cycles.
Intermediate trend - Probably tracing out an ending diagonal pattern.
Analysis of the short-term trend is done on a daily basis with the help of hourly charts. It is an important adjunct to the analysis of daily and weekly charts which discusses the course of longer market trends.
APPROACHING A SHORT-TERM TOP
Market Overview
Since it held at a critical support level (ca. 1865), SPX has been in a short-term uptrend which has taken it to new all-time highs. However, Friday's close of 1923.39 is quickly approaching the stated target of about 1930 for this move. Not only is 1929 a pivot point, but it is also the price projection derived from the short-term accumulation pattern which formed between 1865 and 1870.
In addition, the current cyclical pattern should provide the required timing. A short-term cycle is due to make its high next week, quickly followed by a bottoming one which is scheduled to create a low in (approximately) the second week of June.
At the moment, this is designated as a short-term top, but it also carries the risk of expanding into something more significant. Some important leading indexes have probably already made topping patterns and if they make new lows over the next few weeks, it will be a confirmation that they have started an intermediate downtrend. Some time ago, I expressed the opinion that DJIA appeared to be making a terminal pattern in the form of a diagonal triangle. Nothing in its recent behavior has occurred to change my view. And although NDX made a new high on Friday, it was only by a fraction and its action could be forming a double top.
That leaves only the SPX, NYA and DJT in a clearly defined uptrend, but if other market components are beginning to head in the other direction, it's only a matter of time before they are pulled down as well. The major Kress cycles bottoming at the end of the year have been subdued by the Fed policy of keeping interest rates low, but I suspect that at some point, they will still have their day in the sun! For this reason, and because of the behavior of key leading indexes, we must treat each anticipated short-term top as if it might develop into something more.
Let's look at some charts!
Chart Analysis
Since I mentioned the poor technical condition of some leading indexes, let's start with a comparison of SPX to IWM and XBD. An objective look at these charts (courtesy of QCharts.com) should cause the perma-bulls to have some second thoughts about the health of the stock market. At point A, all three indexes completed a short-term correction and, together, they went on to extend their uptrend. At point B IWM and XBD actually put on a stronger performance than SPX, then became relatively weaker in the next correction which ended at point C. SPX went on to make a new high, but the other two extended their relative weakness into last Friday, both ending far below their high at letter D.
There are two ways to interpret these charts! If the two indices on the right fail to make a new low while SPX only has a mild correction over the next few days, it is possible that all three will start rising together afterwards, thereby prolonging the bull market from 2009. If, on the other hand, all three decline below letter C, the odds that we have started an important decline will have increased. That is a long way down for SPX which has now risen 100 points above that level, but this does not have to be accomplished all at once. All that is necessary is for that index to break below its critical support level of 1870. A close below that price would not only breach support but also the trend line which connects A-C, strongly suggesting that an important decline has started.
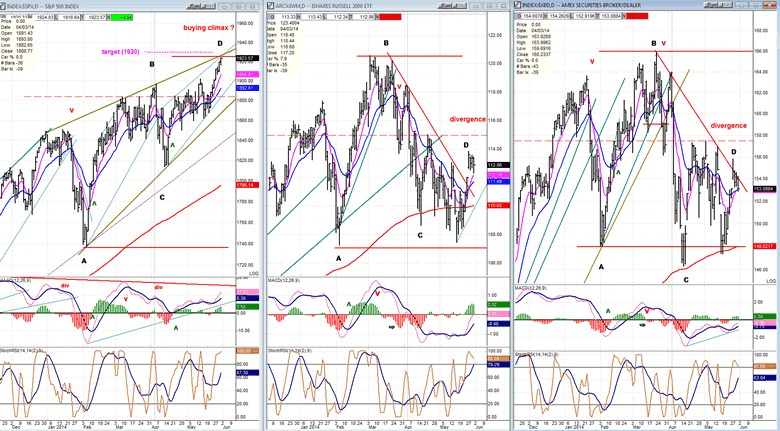
More than likely, that level will have to be tested one more time before giving way. The other two indices will most likely also try to hold again above their 200-MA.
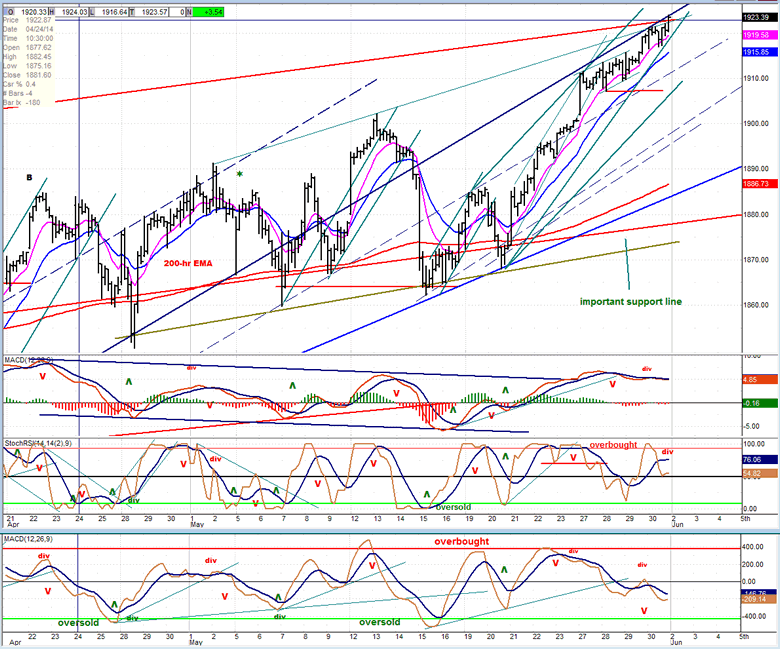
There is not much more that we can glean from the daily charts at this point, but let's see if the SPX hourly chart (also courtesy of QCharts.com) is more helpful.
In fact, it would be difficult to find a more negative set-up for an index which has just risen to a new all-time high. The price itself shows a potential five wave structure, but what is unusual about it is that wave 4 was very shallow and hardly distinguishable from the uptrend. Also glaring is the crawling pattern along the underneath of the previously broken trend line and the deceleration/resistance which it is causing for the index. It looks as if traders are supporting the price for dear life until it reaches its target of a few points higher; afraid that if it starts to reverse sooner, they would not be able to control the avalanche that could follow.
That, of course, is what I see in this price pattern, but it's not necessarily what is. And if so, we should find some confirmation in what the oscillators are telling us. In fact, two of the three have been in a declining pattern since the beginning of the week and the third one joined them on Friday. This makes for an impressive exhibition of negative divergence between the oscillators and the price. At this point, I am not even sure that 1930 can be reached before prices begin to retrace.
Cycles
There are two minor cycles which are expected to make their highs in this time frame. There is also a minor cycle that will be pulling the index down over the next couple of weeks.
Breadth
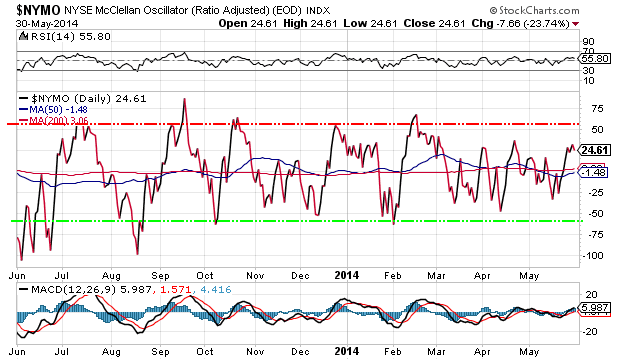
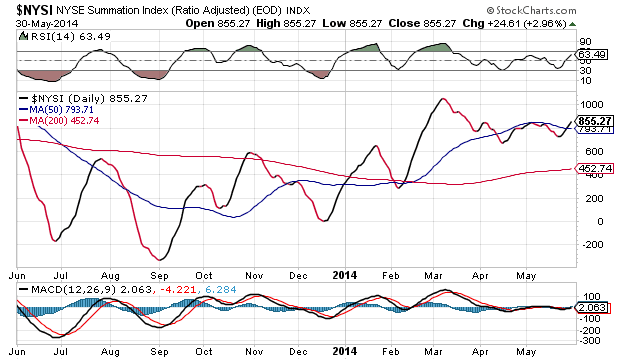
The McClellan Oscillator and the Summation Index appear below (courtesy of StockCharts.com).
Just as it was not able to get down to the normal oversold level, the NYMO is stalling before being able to reach the normal overbought level. While this is a sign of indecisiveness on the part of the indicator, it is not a suitable pattern for an index which just made a new high. In this case, it's another sign of negative divergence. There has been enough positive reading in NYMO to turn the NYSI upward, but it will not be able to extend its move unless NYMO can remain positive.
Just as they did last week, these two indicators bear watching closely. Any sign of turning negative could lead the SPX into a decline.
Sentiment Indicators
"The SentimenTrader (courtesy of same) long term reading has remained the same for five consecutive Fridays, but the short term has jumped a couple notches to 70" -- which had no effect whatsoever on the short-term trend.
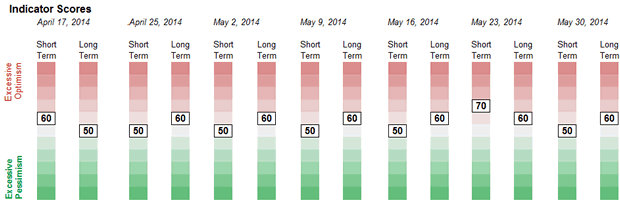
Occasionally, the SentimenTrader comes up with a gem of an observation. Here is another which could be extremely relevant, considering the technical position of the market:

May 23, 2014
The S&P 500 closed at a 52-week high along with only 23 component stocks, and low pre-holiday volume.
It would be interesting to know how many of its components followed it to a new high on Friday!
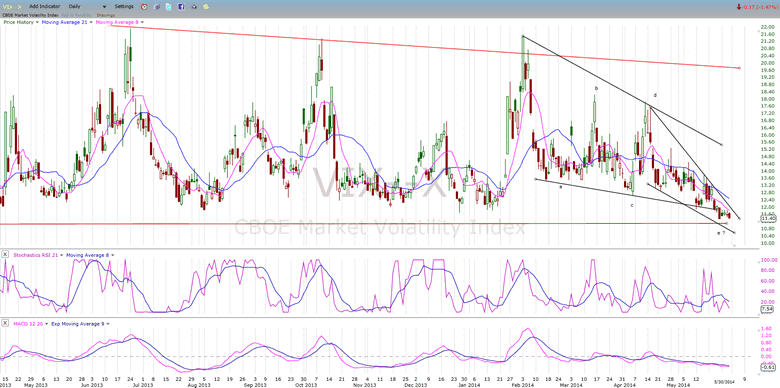
VIX (CBOE volatility Index)
VIX has returned to the level of of a year ago and, for the time being, appears to be holding it. While SPX tacked on another 23 points to a new high during the week, VIX made its low a week ago in a little climactic move and held on to it during the past week. Does this long-term and short-term divergence with SPX have any significance? We'll find out next week.
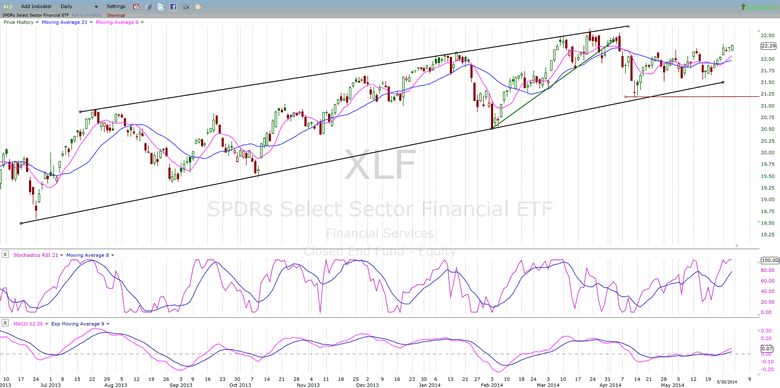
XLF (Financial ETF)
A similar pattern can be seen in the XLF which made its high for the week on Tuesday, but was not able to exceed it for the next three days. A second pattern of non-confirmation now has my attention. That and the mention that only a small percentage of the S&P components are responsible for its making new highs!
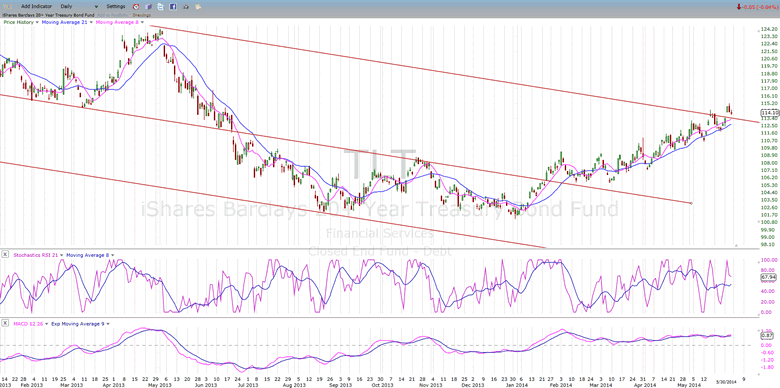
TLT (20+yr Treasury Bond Fund)
Last week I noted that TLT could first overcome its top channel line and then consolidate. That appears to be what the index has in mind. Incidentally, we should be aware of the fact that this channel represents TLT's long-term correction pattern and a break outside of it may effectively be putting it back in a long-tern uptrend.
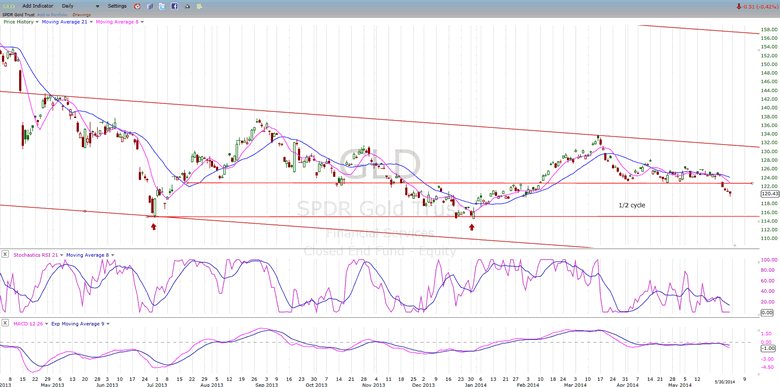
GLD (ETF for gold)
Last week, I also mentioned that GLD had probably missed the opportunity to move higher during its 25-wk cycle up-phase, and that it stood the risk of being pushed lower as the cycle entered its hard-down-phase. That seems to be what is taking place.
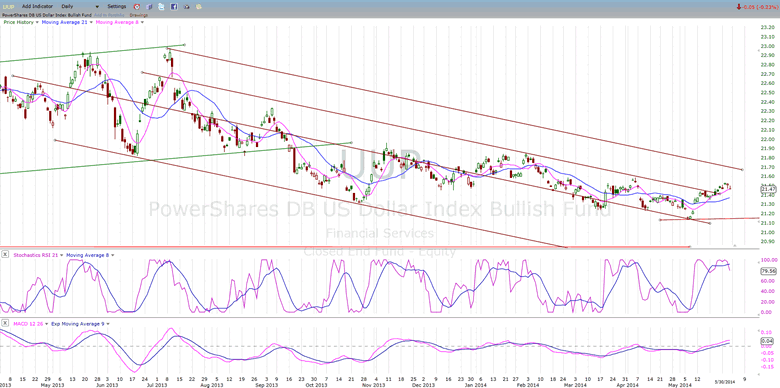
UUP (dollar ETF)
As you know, I believe that GLD and UUP are both affected by the same, but opposite, forces which have their basis in the 25-wk cycle. Their moves are not exaclty the inverse of each other, but there is enough consistency in the patterns to show that it's probably a valid theory. If correct, the dollar should continue to improve while gold should continue to decline for the next couple of weeks -- which is when the cycle should reverse its course.
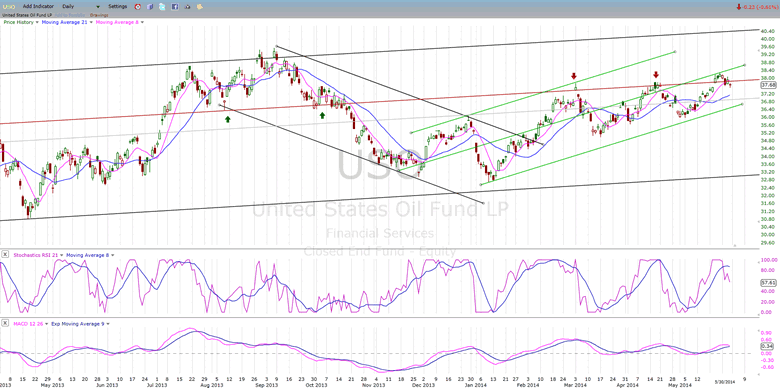
USO (US Oil Fund)
I had expected USO to find resistance at its mid-channel line, and it did. It has also dropped slightly below the red resistance/support line which is marked by arrows. If it declines too much, it may again have trouble getting back above on its next attempt.
Summary
SPX is giving us ample technical warning that it is coming into a short-term top. Besides approaching its projection target, it is also showing plenty of negative divergence in its hourly oscillators.
At this stage of the current extended long-term uptrend, there is a growing risk that any short-term reversal will turn into something more significant. This risk can be reduced or amplified by the jobs report which is due at the end of the coming week; and how its results are interpreted by traders.
FREE TRIAL SUBSCRIPTON
If precision in market timing for all time framesis something that you find important, you should
Consider taking a trial subscription to my service. It is free, and you will have four weeks to evaluate its worth. It embodies many years of research with the eventual goal of understanding as perfectly as possible how the market functions. I believe that I have achieved this goal.
For a FREE 4-week trial, Send an email to: ajg@cybertrails.com
For further subscription options, payment plans, and for important general information, I encourage
you to visit my website at www.marketurningpoints.com. It contains summaries of my background, my
investment and trading strategies, and my unique method of intra-day communication with
subscribers. I have also started an archive of former newsletters so that you can not only evaluate past performance, but also be aware of the increasing accuracy of forecasts.
Disclaimer - The above comments about the financial markets are based purely on what I consider to be sound technical analysis principles uncompromised by fundamental considerations. They represent my own opinion and are not meant to be construed as trading or investment advice, but are offered as an analytical point of view which might be of interest to those who follow stock market cycles and technical analysis.
Andre Gratian Archive |
© 2005-2022 http://www.MarketOracle.co.uk - The Market Oracle is a FREE Daily Financial Markets Analysis & Forecasting online publication.