


AUD-NZD Pullback Opportunity
Currencies / Forex Trading Jul 30, 2014 - 06:55 PM GMTBy: Austin_Galt

Well, the AUDNZD absolutely exploded out of that false break low pattern identified a few weeks ago. I was hoping to add more long positions at the start of last week but wasn't nimble enough. I may just get another opportunity shortly albeit at higher prices but sometimes you just gotta roll with the punches. The market is the big boss and I am but its mere minion. Let's take a look at what's currently being offered up with the daily chart.
Daily Chart
As the month of July comes to an end, perhaps we can reflect for a moment. It certainly has turned out to be a cracker of a month. Well, for the bulls anyway. But the market moves on, trying to formulate its next devious strategy. Perhaps it's thinking it's time for a pullback and hopefully shake some of those bulls out of their positions. Not me though. Only a break below the July low of 1.062 will relieve me of mine.
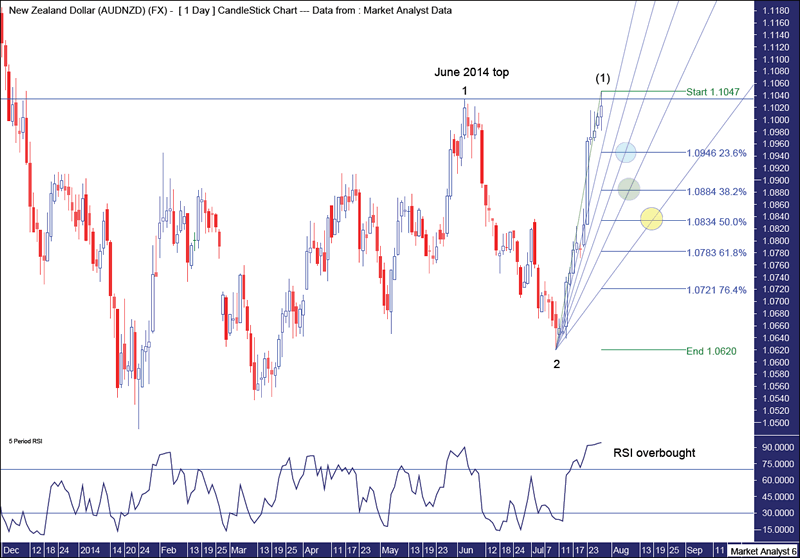
I have added Fibonacci retracement levels of the move up from that July low to the recent July high of 1.1047. We can see this top took out the resistance level of the June 2014 top. Nice indeed and this demonstrates the strength of this move up.
It was this strength that I underestimated at the start of the previous week when attempting to average up. I was looking to add long positions on a pullback to the 38.2% Fibonacci level. But price only came back and clipped the 23.6% level. I generally don't like getting into positions at that level. It's really just a personal thing. Probably just me being too stingy!
I have also added a Fibonacci Fan and combining that with the retracement levels, I have identified several potential areas for the pullback to end. Considering the price strength, I thought I better include the 23.6% level this time which stands at 1.0946. I have drawn a blue circle where this level intersects with the 50% angle. The next area is in the green circle where the 61.8% angle meets the 38.2% level at 1.0884. One of these areas is my preferred outcome and the timing period is the end of the first week and second week of August. Personally, I favour more the green circle scenario but that's just me speculating. The other area I have identified pertains to the yellow circle in which the 76.4% angle intersects the 50% level at 1.0834. This is set to occur in the third week of August and is definitely a possibility. Let's see.
I have added the Relative Strength Indicator (RSI) and we can see the recent price high has coincided with an extremely overbought RSI reading above 94. High readings like that don't occur too often so a pullback will be just the tonic to relieve this pressure.
Finally, I've had a stab at putting some Elliott Wave annotations on the chart. Now I ain't no Elliott Wave expert (surely they don't speak like that anyway!), and I don't get too bothered if I break the occasional rule (aren't rules made for breaking anyway?!). Personally, I find EW useful in providing some structure and clarity to the trend.
So, we can see that the June high was the end of Wave 1 and the July low the end of Wave 2 which means we are now in the impulsive Wave 3. Yep, that explains the recent explosion higher. However, I think this recent move was a Wave 1 within the Wave 3. So hold on to your hats folks as this implies that once the pullback is over a Wave 3 within Wave 3 is set to commence. BOOM!
Yikes, I can hardly contain my excitement. Might be time for a lie down!
Bio
I have studied charts for over 20 years and currently am a private trader. Several years ago I worked as a licensed advisor with a well known Australian stock broker. While there was an abundance of fundamental analysts there seemed to be a dearth of technical analysts, at least ones that had a reasonable idea of things. So my aim here is to provide my view of technical analysis that is both intriguing and misunderstood by many. I like to refer to it as the black magic of stock market analysis.
Please register your interest in my website coming soon. Any questions or suggestions, please contact austingalt@hotmail.com
© 2014 Copyright Austin Galt - All Rights Reserved
Disclaimer: The above is a matter of opinion provided for general information purposes only and is not intended as investment advice. Information and analysis above are derived from sources and utilising methods believed to be reliable, but we cannot accept responsibility for any losses you may incur as a result of this analysis. Individuals should consult with their personal financial advisors.
© 2005-2022 http://www.MarketOracle.co.uk - The Market Oracle is a FREE Daily Financial Markets Analysis & Forecasting online publication.