


HUI Gold Mining Stocks Elliott Wave Projection
Commodities / Gold and Silver Stocks 2014 Aug 25, 2014 - 07:33 PM GMTBy: Trader_MC

 Miners bull and bear markets structures can be clearly identified with the Elliott Wave Principle and look ready soon to enter a new impulsive move up. Keeping an eye on the Elliott Wave structure is important as this tool is mostly used by institutionals and hedge fund managers.
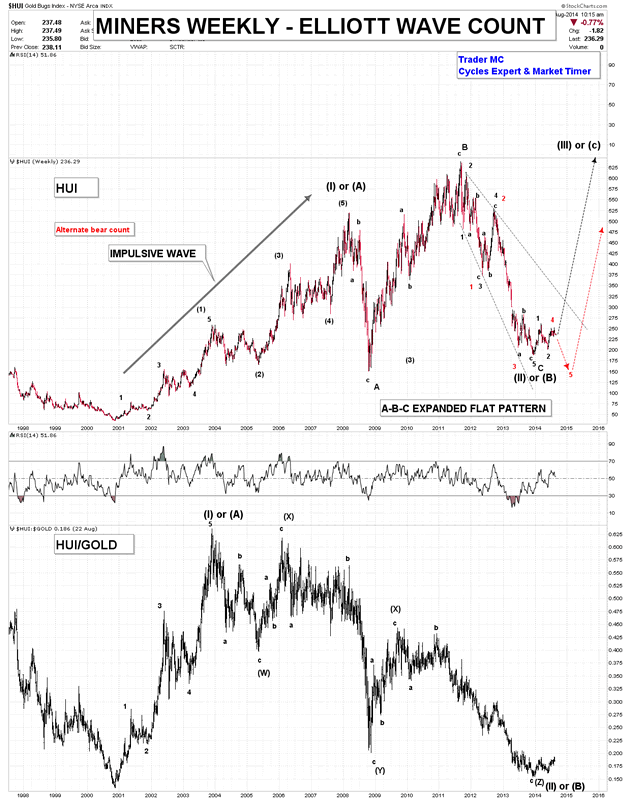
On the chart below you can see that the move from 2000 low to 2008 high is clearly an impulsive move which I labeled Wave (I) or Wave (A). This impulsive move has been followed by a corrective pattern which revealed to be an Expanded Flat Pattern (labeled A-B-C). The structure of a Flat Pattern is called a 3-3-5 which indicates that Waves A and B are both composed of three waves and Wave C is composed of five waves. I think that Wave C of the Expanded Flat Pattern took the form of an Expanding Wedge Pattern and has ended right at the bottom in December 2013. This bottom could mark the end of either a Wave (II) or a Wave (B) but in both cases we should soon see a new impulsive leg up labeled Wave (III) or Wave (C). I have also put an alternate red count which indicates that a possible impulsive Wave 5 down could be underway and reach the $150 level but I do not favor this case for the moment. Price action in the coming weeks will be key and the HUI Index should reveal its intentions very soon.
The HUI/Gold ratio chart shows that the impulsive move Wave (I) or Wave (A) from 2000 bottom to 2003 high has been followed by a long Triple Threes Corrective Pattern labeled (W)-(X)-(Y)-(X)-(Z) for a Wave (II) or a Wave (B). You can notice that the HUI/Gold ratio is at the same level as the bottom in 2000 which indicates that Miners are extremely undervalued and at a level that could generate a strong move up.
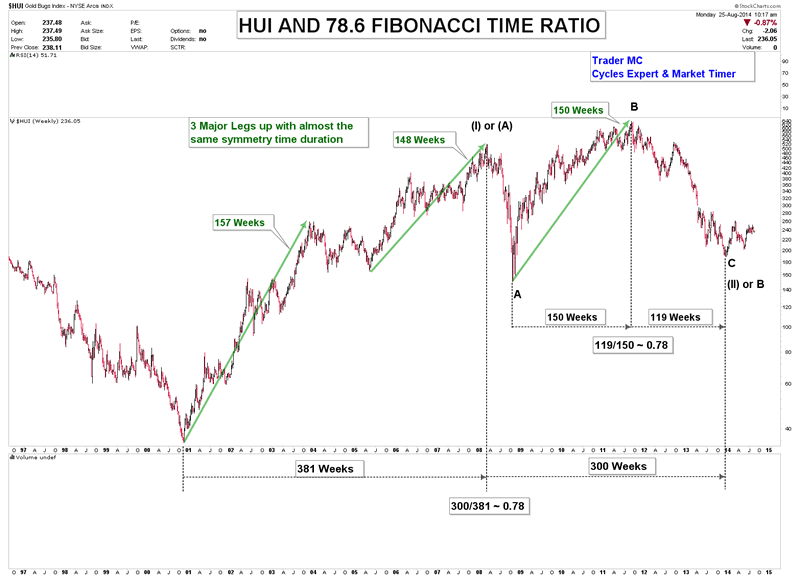
The impulsive Wave (I) or (A) lasted 381 weeks and the corrective Expanded Flat Pattern lasted exactly 300 weeks which shows a time period ratio of 0.78 (Fibonacci ratio). The HUI Index has always been connected to the 0.78 Fibonacci ratio both in price and time and it should not be a surprise that such impulsive move from $35 to $520 has been corrected by a pattern of 300 weeks’ time duration.
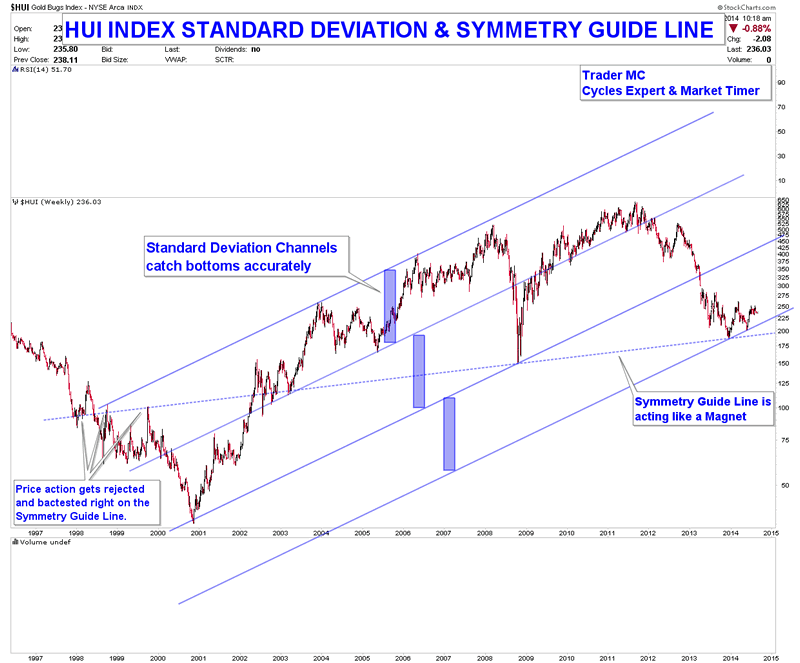
On the chart below you can see that the HUI Index is still holding above its standard deviation channel and its symmetry guide line that caught exactly the 2008 and 2013 bottoms. It is bullish price action until the market proves otherwise.
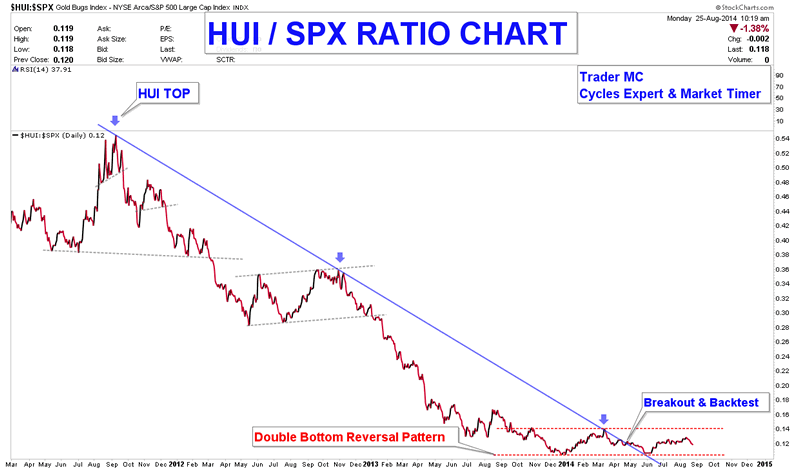
The last chart is the HUI/SPX ratio which is forming a Reversal Base Pattern and a bullish breakout would mean that Miners are outperforming the Stock Market.
The Elliott Wave Principle applied to the HUI structure is telling me that an impulsive Wave (III) or Wave (C) could be underway very soon as markets are always composed of at least two impulsive legs up. The Elliott Wave Principle combined with the analysis of the element of time makes me favor the black bull count for the moment. In case the market chooses the alternate red count, one of the great advantages of the Elliott Wave tool is to prepare the trader psychologically for the highest outcome but also to alert quickly in case of a different scenario. Until the market reveals his hands it is important to be patient as a bull market never goes straight up. Trying to get in and out usually ends up by losing money as traders are shaken out by the strong hands. This is how bull market works.
Trader MC
Company: Cycle Trader MC OU
Web site: http://tradermc.com
Email: contact@tradermc.com
My analysis covers different assets – Market Indexes, such as US, Europe, Emerging Markets, China, Russia etc., Commodities, Currencies (Forex Trading), Bonds and Rates. In addition to the Markets Updates for MC Members, I also post real-time Trading Alerts for MC Leveraged Members for a more aggressive strategy in all the sectors. Besides the market analysis, this site also contains Cycles Count Updates for all Market Assets, including the Forex Market.
© 2014 Copyright Trader MC - All Rights Reserved
Disclaimer: The above is a matter of opinion provided for general information purposes only and is not intended as investment advice. Information and analysis above are derived from sources and utilising methods believed to be reliable, but we cannot accept responsibility for any losses you may incur as a result of this analysis. Individuals should consult with their personal financial advisors.
© 2005-2022 http://www.MarketOracle.co.uk - The Market Oracle is a FREE Daily Financial Markets Analysis & Forecasting online publication.