


Stock Market Pullback Continues
Stock-Markets / Stock Markets 2014 Sep 13, 2014 - 08:45 PM GMTBy: Tony_Caldaro

 After closing within three points of the all time high last week, the market went into a choppy pullback mode this week. For the week the SPX/DOW were -1.0%, the NDX/NAZ were -0.4%, and the DJ World index was -1.4%. On the economic front, reports came in mostly to the positive. On the uptick: consumer credit, retail sales, wholesale/business inventories, import prices, consumer sentiment, and the budget deficit improved. On the downtick: export prices, the WLEI and weekly jobless claims increased. Next week is FOMC week, and we get reports on Industrial production and Housing.
LONG TERM: bull market
Here we are 66 months into this bull market and we are still trying to identify the top of Primary III, in a five primary wave bull market. The western central banks have been propping up liquidity since the bull market began. The FED with QE’s 1, 2, 3 and Operation Twist. The ECB with LTRO’s 1 and 2, and now ABS. During this period the SPX has tripled, and is more than 25% above its 2007 all time high. Germany’s DAX has nearly tripled as well, and is more than 23% above its all time high. With the ECB just starting ABS another liquidity injection is thrown into the count.
Thus far we have counted Primary waves I and II completing in 2011. Primary III could have topped in 2013, but extended into 2014. The current uptrend has the potential to end Primary III, as we can count five Intermediate waves up from the Major wave 4 low in February at SPX 1738. However, there are two problems with this count, one in the DOW and the other in the NDX/NAZ. We detailed these problems in the last weekend update, and the one two weeks before that. Currently we think the probabilities of Primary III ending with this uptrend, or extending into next year, are equal.
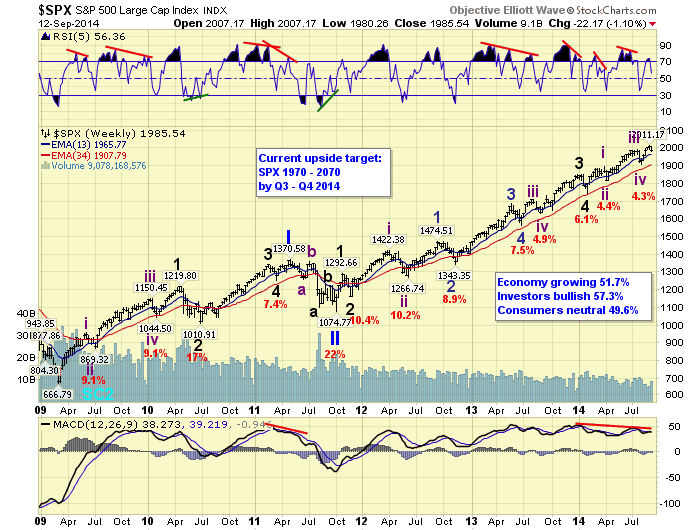
The key levels to watch are first SPX 1905. If the market revisits this level Primary III probably ended at SPX 2011. Second SPX 2011. If the market rises above this level the uptrend is probably extending. Third SPX 1991. Should the uptrend extend it has to rise high enough to avoid overlapping the high of the previous uptrend. Since we are in pullback mode now, SPX 1905 and 2011 are the current levels to watch.
MEDIUM TERM: uptrend
From the early August low of SPX 1905 we have counted five waves up into 2011 a week ago. Since this was a five wave pattern and the market made new all time highs it could have completed the uptrend, and with it Primary III. The expected pullback to medium term support at the 1973 or 1956 pivots just occurred on friday. As the SPX hit the upper range of the 1973 pivot. At friday’s low the market was sufficiently oversold if this uptrend is going to extend. But we think there maybe one more wave down.
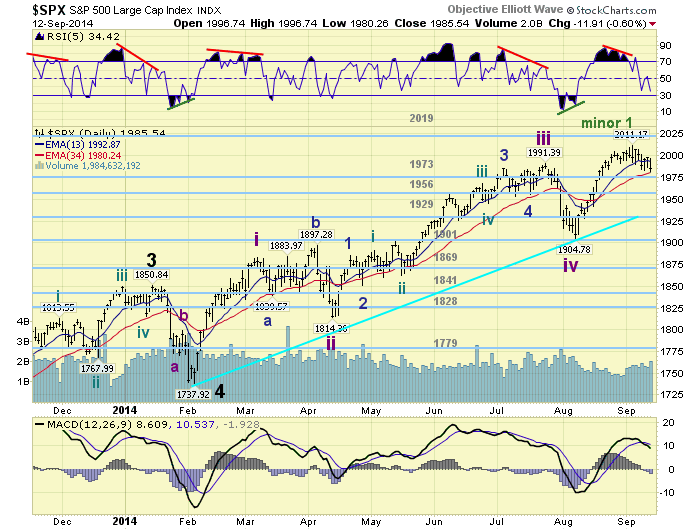
If the uptrend does extend the five wave sequence up to SPX 2011 would be counted as Minor wave 1 of the Intermediate wave v uptrend. And SPX 1980, or lower, would be Minor wave 2. Minor wave 3 would then be getting underway. The rally to follow would take the market to the OEW 2070 pivot, or even higher, to complete Minor waves 3, 4 and 5. Currently the market remains in between the SPX 2011 uptrend high and the 1980 recent low. We can not confirm a Minor wave 3 rally until the market starts making new highs. Medium term support remains at the 1973 and 1956 pivots, with resistance at the 2019 and 2070 pivots.
SHORT TERM
The five waves up during this uptrend were as follows. Waves 1 and 2 SPX 1945 and 1928. Wave 3 subdivided into five waves: SPX 1964-1942-1995-1985-2005. Wave 4 declined to SPX 1991, and wave 5 completed in a diagonal triangle: 2006-1995-2009-1998-2011. After that high we had a choppy pullback to SPX 1980. We have counted a simple wave ‘a’ at SPX 1990, wave ‘b’ at 2008, then a wave ‘c’ 1991-2000-1983-1997-1986-1998-1980.
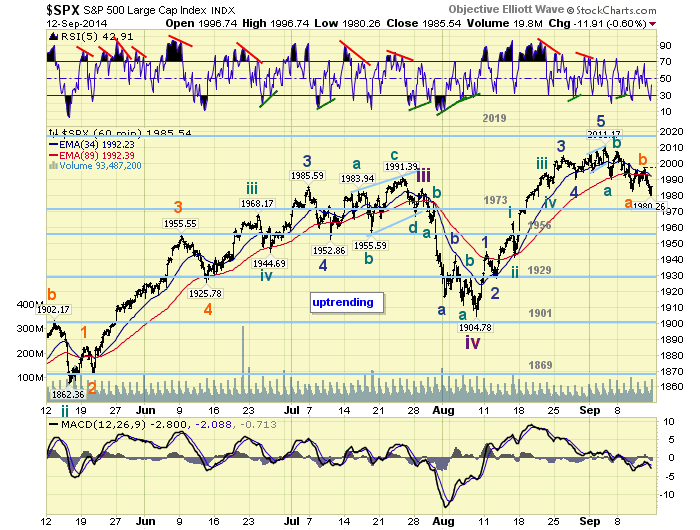
If we count 1991-2000-1983 as wave a of ‘c’, 1997-1986-1998 as wave b of ‘c’, and 1980 as the beginning of another three wave sequence for wave c of ‘c’. We should see a small rally early next week, then another decline to lower lows. Since wave ‘a’ was 21 points (2011-1990), a wave ‘c’ of 34 points should bottom at SPX 1974. Also since wave ‘a’ of c was 25 points, another decline of 25 points from SPX 1998 suggests 1973. So the OEW 1973 pivot appears to be the Fibonacci fit on both the larger and smaller waves of this pullback. Short term support is at the 1973 and 1956 pivots, with resistance at SPX 2011 and the 2019 pivot. Short term momentum ended the week just under neutral.
FOREIGN MARKETS
Asian markets were mostly lower for a net loss of 0.5%.
European markets were mostly lower and lost 1.3%.
The Commodity equity group were all lower losing 3.4%.
The DJ World index lost 1.4%.
COMMODITIES
Bonds confirmed a downtrend this week, -0.9%, as yields have again began to rise.
Crude remains in a downtrend losing 1.2%.
Gold continues to downtrend losing 3.0% on the week.
The USD uptrend continues gaining 0.5%.
NEXT WEEK
Monday: the NY FED at 8:30, then Industrial production at 9:15. Tuesday: the PPI, and senate testimony from FED director Hunter. Wednesday: the CPI, the NAHB, and the FOMC statment. Thursday: weekly Jobless claims, Housing starts, Building permits, the Philly FED, and a speech from FED chair Yellen. Friday: Leading indicators and Options expiration. By the looks of things next week could be quite volatile. Best to your weekend and week!
CHARTS: http://stockcharts.com/public/1269446/tenpp
http://caldaroew.spaces.live.com
After about 40 years of investing in the markets one learns that the markets are constantly changing, not only in price, but in what drives the markets. In the 1960s, the Nifty Fifty were the leaders of the stock market. In the 1970s, stock selection using Technical Analysis was important, as the market stayed with a trading range for the entire decade. In the 1980s, the market finally broke out of it doldrums, as the DOW broke through 1100 in 1982, and launched the greatest bull market on record.
Sharing is an important aspect of a life. Over 100 people have joined our group, from all walks of life, covering twenty three countries across the globe. It's been the most fun I have ever had in the market. Sharing uncommon knowledge, with investors. In hope of aiding them in finding their financial independence.
Copyright © 2014 Tony Caldaro - All Rights Reserved Disclaimer: The above is a matter of opinion provided for general information purposes only and is not intended as investment advice. Information and analysis above are derived from sources and utilising methods believed to be reliable, but we cannot accept responsibility for any losses you may incur as a result of this analysis. Individuals should consult with their personal financial advisors.
Tony Caldaro Archive |
© 2005-2022 http://www.MarketOracle.co.uk - The Market Oracle is a FREE Daily Financial Markets Analysis & Forecasting online publication.