


Stock Market Topping Process Update
Stock-Markets / Stock Markets 2014 Sep 22, 2014 - 10:06 AM GMTBy: Andre_Gratian

 Current Position of the Market
SPX: Long-term trend - In 1932 and 1974, the 40-yr cycle was responsible for protracted market weakness. The current phase is due this year but where is the weakness? Has man (Federal Reserve) finally achieved dominance over universal rhythms or has it simply delayed the inevitable?
Intermediate trend - We are looking for the move from 1905 to end, after which a much more serious correction should start.
Analysis of the short-term trend is done on a daily basis with the help of hourly charts. It is an important adjunct to the analysis of daily and weekly charts which discusses the course of longer market trends.
TOPPING PROCESS UPDATE
Market Overview
The individual indexes which make up the whole market are a mixed-bag, ranging from a strong Dow Industrials and Transportation to a weak NYSE Composite and Russell 2000. The SPX falls into the upper range, but has problems of its own. Let's dissect it:
Momentum: The good news is that the SPX MACDs of various time frames (weekly, daily, hourly, 5m) are all positive. The bad news is that, in spite of the recent rally from 1978 - and because of Friday's pull-back -- all of the MACD moving averages have made bearish crosses! It may mean nothing and, as soon as the SPX turns up again, most, if not all, will make bullish crosses. However, since Friday ended on a down note, let's see what follows next week. In addition, note that although it made a new high, the index did not hold it and closed below the former high.
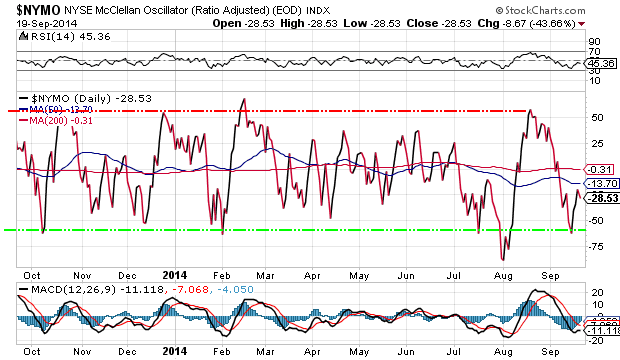
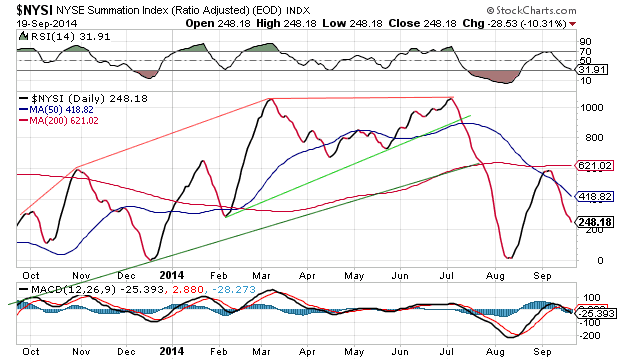
Breadth: Because the McClellan Oscillator remained negative for the whole week, the McClellan Summation Index has continued to decline, but remains positive at a reading of 248. The McClellan Oscillator was not able to go positive in spite of a 40-point price advance in the SPX. In that sense, it more closely reflects the performance of the NYA which, even though it traded higher (but did not make a new high) gave up a lot of ground and closed the week at the halfway point of its former decline. This one will have to be watched closely! NASDAQ breadth is a little weaker than that of the NYSE.
VIX: In spite of the new highs in the DJIA and SPX, VIX did not make a new low. This amounts to double positive divergence but is not a strong signal until the index turns up decisively again.
Structure: Most EW analysts agree that we are now in the final wave (5) of the advance from 1905, which, when complete, should trigger the beginning of primary wave IV. Since primary wave II declined 250 points, could we not reasonably expect something of the same magnitude for wave IV?
Accumulation/distribution: The SPX formation above 1979 turned out to be a re-accumulation pattern which has filled its absolute minimum P&F projection just shy of 1920. Since there is a legitimate count to a higher target, what we do early next week will be very important.
Everything considered, it appears that SPX has reluctantly made a new high. Let's see what it does next!
Chart Analysis
I want to focus on the portion of the daily SPX chart (courtesy of QCharts.com) which starts at 1905. This is where we should find the most clues when deciphering the course of the near-term trend.
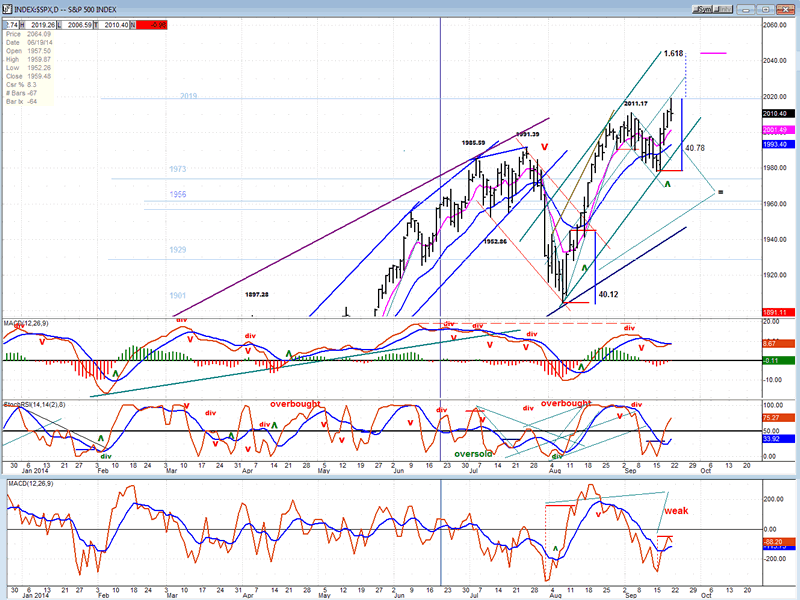
I have drawn a trend line between the two lows and a parallel as the top line so that we now have a channel which represents the current uptrend. I have also drawn a thin mid-channel line. Note that the initial break-out wave stopped on that line. This should help to assess the strength of the move which purportedly represents wave 5 from 1905. A strong uptrend would slice through the mid-point of the channel and go all the way to the top. If, after the current minor pull-back, the index is able to do this, we will know that we have a strong move which will have some lasting power. On the other hand, if it cannot, the opposite will be true and we should start preparing for the end of the move.
Note the two vertical blue lines that I have drawn on the chart: they are equal to a fraction of a point. Why is this important? Because it is often the case that wave 5 of an impulse wave (which is what this move is supposed to be) is equal to wave 1 (or has a Fibonacci relationship to wave 1). Therefore, since we have started to retrace, if the retracement continues with increasing weakness, we might start looking at the possibility that wave 5 has already come to an end (although the structure does not look complete). If the index should move past 2019, we shall see if it extends to the pink horizontal line and stops there.
Now, let's turn to the indicators. Prices are above the two short-term MAs, and that is bullish! But only one of the oscillators (SRSI) has given a buy signal. The MACD is always a laggard, so we cannot pass judgment on it, except to say that it would take little to make it completely positive with a bullish cross.
The worrisome indicator (for the bulls) is the lower oscillator which represents breadth. If anything is representative of a market top this one is! A strong market needs good breadth support. This indicator shows the opposite and, if it persists, it will be telling us that an end to the move from 1905 can come at any time. When we do get a reversal, the odds will strongly favor that it will probably bring more weakness than we have seen since the second half of 2011.
Now let's switch to the hourly chart (also courtesy of Q.Charts.com) for the short term perspective.
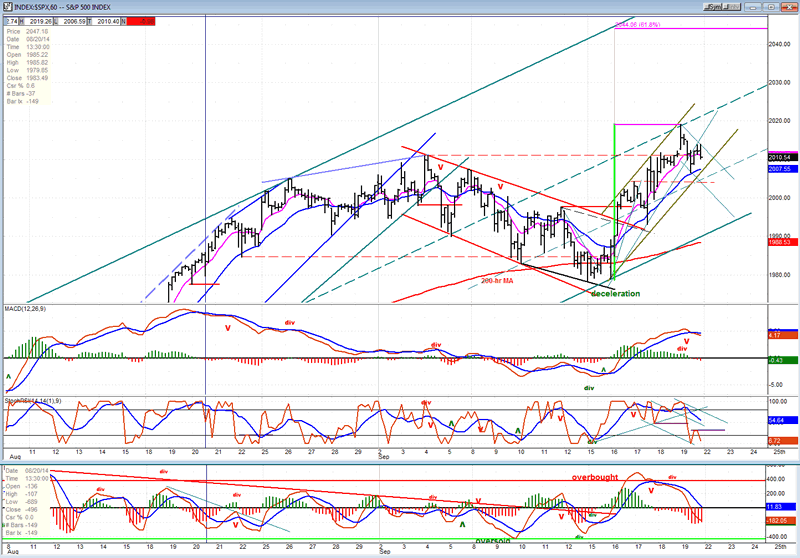
When analyzing this chart, we'll concentrate on the break-out from the correction pattern. It was preceded by some deceleration when the price refused to make it all the way to the bottom of the red channel. After we broke out, the first pull-back came from 2004. The second from 2019! This has generated some disagreement among the EW analysts as to where wave 1 (of 5 from 1905) ended. We'll let them argue and surmise the market's intention through other methods.
As mentioned when analyzing the daily chart, the move to 2019 was the same length as the first wave from 1905. It the high has been reached, we should now see some real weakness develop. If not, we can assume that we will be moving higher, and I have marked the .618 extension of the initial move which would take the index to 2044. Incidentally, this target pretty much matches a P&F projection.
Turning to the indicators, note how well the blue 21-MA tends to hold prices in an uptrend or downtrend. So the first thing we should watch is if the current pull-back takes us below that MA, and by how far. A logical point for the pull-back would be down to 2004 which would be a .318 retracement of the entire move, finding support on the dashed line across the top of the first up-move. However, this would put SPX below its blue MA and it would have to rally immediately to stay in an uptrend.
All the oscillators agree that the pull-back is most likely not finished, so chances are pretty good that we should open weak on Monday. But the real challenge will come when (if) we resume the uptrend to see how it develops and how far it goes.
Breadth
The McClellan Oscillator and the Summation Index appear below (courtesy of StockCharts.com).
These charts best show the weakness of breadth support during the move to a new high. And that may not be the end of it! Since we are expecting the minor correction which started on Friday to continue, while it may not take the McClellan Oscillator to a new low, it will certainly cause the NYSI to extend its decline. Unless we have some good strength returning to these indices - and soon - we cannot remain in an uptrend for long, and any continuing sign of weakness will speed up the arrival of an important market reversal.
Sentiment Indicators
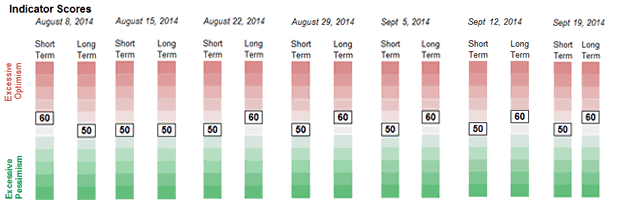
The SentimenTrader (courtesy of same) long term indicator remains at 60 for the fifth consecutive week. This is another reason to believe that the SPX may not yet have reached the top of its move from 1905. A reading of 70 would be more appropriate to a top.
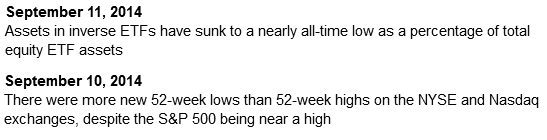
Here are a couple of recent and interesting comments from the SentimenTrader:
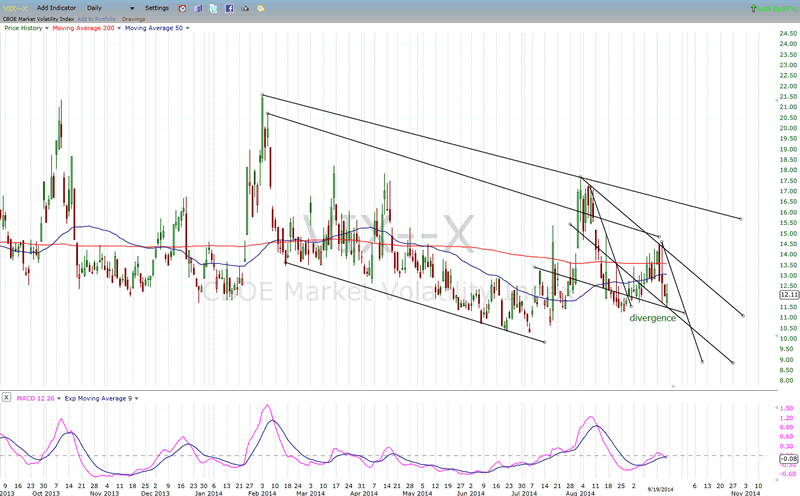
VIX (NYSE Volatility Index) - Leads and confirms market reversals.
VIX is getting stronger relative to SPX, but it is in a short-term downtrend and could easily make a new low and pare some of that positive divergence. It has support where it is or slightly lower from two intersecting inner trend parallel lines. If it goes below them, the uptrend in stocks should continue. On a longer term perspective, it has been fluctuating on both sides of its 200-DMA. After starting an uptrend, it must break above and pull away from it to confirm that an intermediate reversal has occurred in the market.
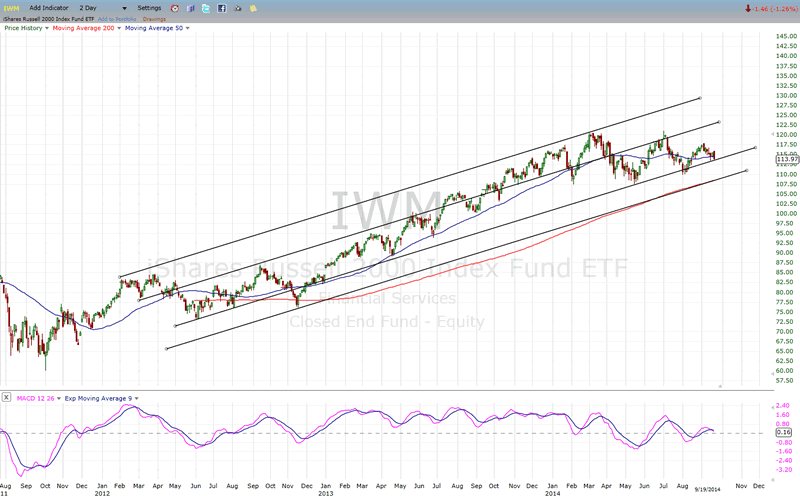
IWM (iShares Russell 2000 ) - Historically a market leader.
I have repeatedly mentioned that when we start a correction, it will be one that will correct the entire uptrend from late 2011. This is what IWM intimates and it is more ready than any other index to start this correction. Keep your eyes on it!
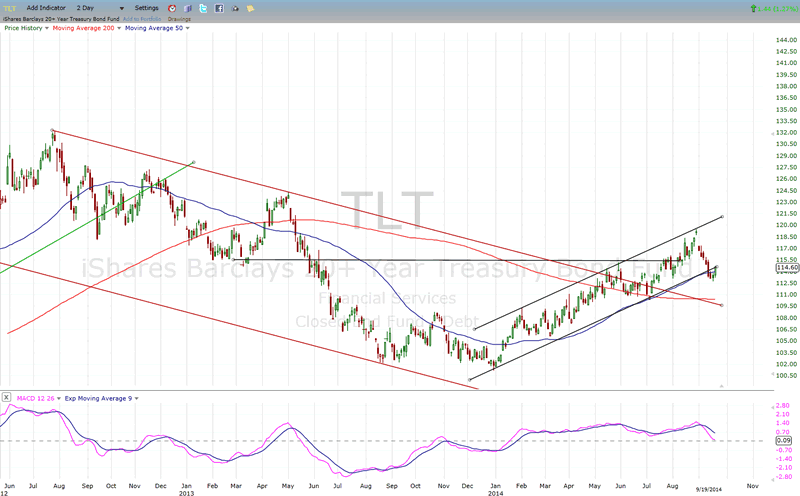
TLT (20+yr Treasury Bond Fund) - Normally runs contrary to the equities market.
It is clear that TLT has broken out of its major correction pattern and has resumed an uptrend which may, or may not take it to a new high. Right now, after breaking out of its corrective channel, the index is having a minor pull-back. If it goes lower, it will have plenty of support from the 200-DMA and the upper, larger channel line, but it is already at a support level provided by the top of the 3rd phase of its advance.
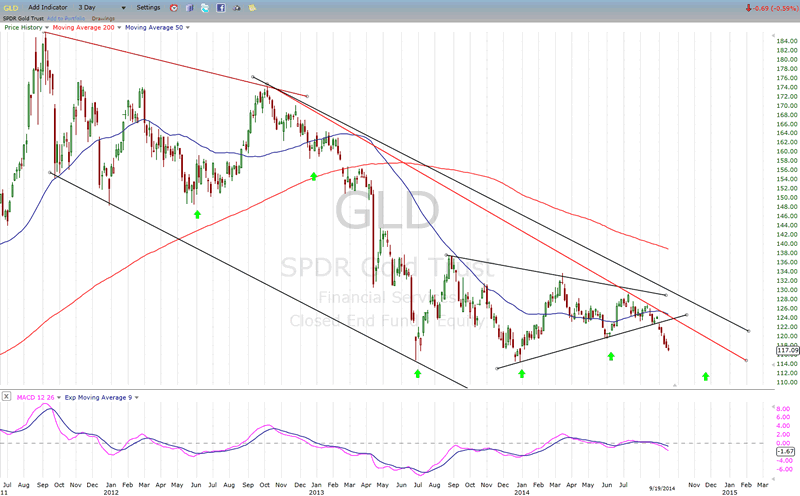
GLD (ETF for gold) - - runs contrary to the dollar index
There is not too much hope for gold to make a low before it reaches the bottom of its 25-wk cycle which is due in November. If it breaks major support at 114, next stop could be 12-14 points lower.
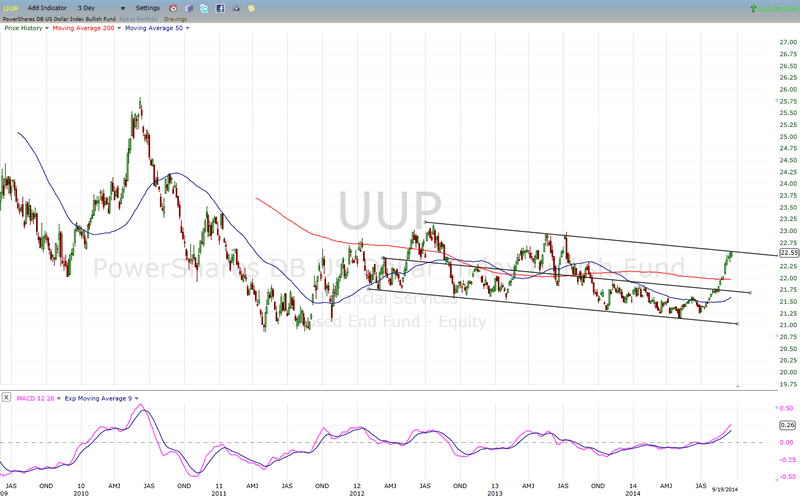
UUP (dollar ETF)
Over the past three years UUP has built an important base from which it is just beginning to emerge. A clean break-out above 23.50 would immediately take it to about 25/26 which would correspond to a move by the dollar to about 91. Such a move would put continued pressure on gold and oil.
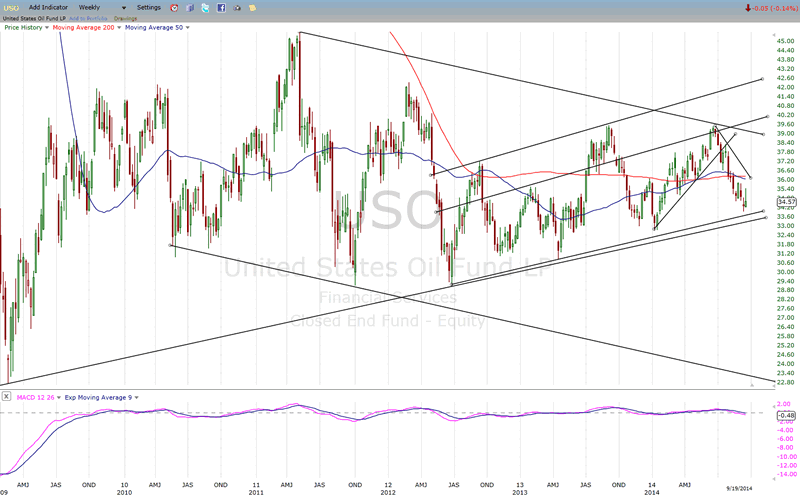
USO (US Oil Fund) - (following chart courtesy of QCharts.com)
USO is approaching significant support created by two important trend lines, one from mid-2012, and the other from 2009. If my analysis of UUP is correct, neither will stop the downtrend in which USO finds itself, with a penetration of both sooner rather than later.
Summary
While the DOW is surging to new highs, the NYSE Composite appears to have made a double top in September and has refused to make a new high in this latest rally. It is following the example of the Russell 2000 which created a similar pattern earlier this year and is one of the weakest indices. The S&P mid-cap index now appears bent on following their example. It has produced one of the weakest rallies since 9/16, and has already retraced most of it.
This trio has formed a powerful bearish alliance which may soon be augmented by others and which is posing a serious threat to the bullish camp.
FREE TRIAL SUBSCRIPTON
If precision in market timing for all time framesis something that you find important, you should
Consider taking a trial subscription to my service. It is free, and you will have four weeks to evaluate its worth. It embodies many years of research with the eventual goal of understanding as perfectly as possible how the market functions. I believe that I have achieved this goal.
For a FREE 4-week trial, Send an email to: ajg@cybertrails.com
For further subscription options, payment plans, and for important general information, I encourage
you to visit my website at www.marketurningpoints.com. It contains summaries of my background, my
investment and trading strategies, and my unique method of intra-day communication with
subscribers. I have also started an archive of former newsletters so that you can not only evaluate past performance, but also be aware of the increasing accuracy of forecasts.
Disclaimer - The above comments about the financial markets are based purely on what I consider to be sound technical analysis principles uncompromised by fundamental considerations. They represent my own opinion and are not meant to be construed as trading or investment advice, but are offered as an analytical point of view which might be of interest to those who follow stock market cycles and technical analysis.
Andre Gratian Archive |
© 2005-2022 http://www.MarketOracle.co.uk - The Market Oracle is a FREE Daily Financial Markets Analysis & Forecasting online publication.