


The U.S. Dollar’s Crucial Role in the Commodity Cycle
Commodities / US Dollar Nov 12, 2014 - 03:45 PM GMTBy: Harry_Dent

 The U.S. dollar is falling and it’ll ultimately crash and go down to near zero. Not true… that’s what the gold bugs keep harping on but it’s not true.
This misinformation is very representative of what’s going on in the global economy and it’s almost as bad as the liberal economists and analysts who believe we should just print as much money as necessary to keep the economy growing.
Let’s just start with the truth.
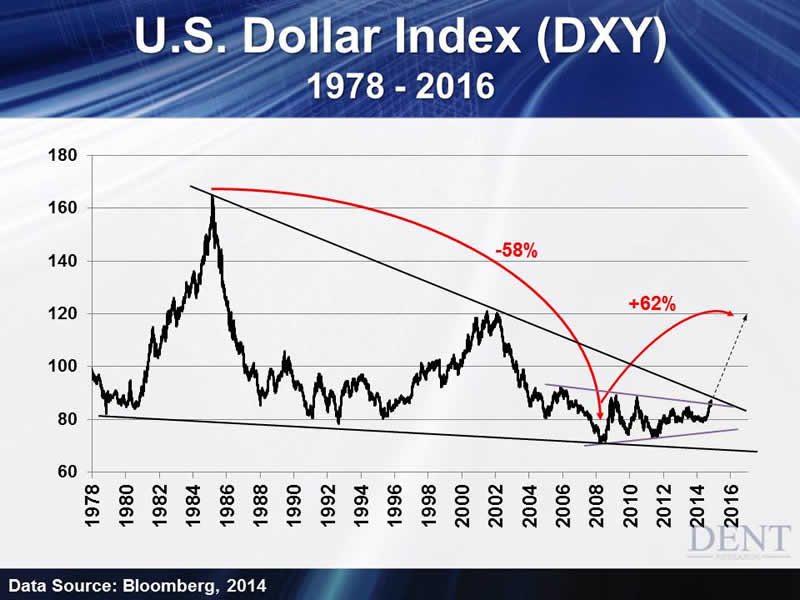
The U.S. dollar did fall dramatically from 1985 into early 2008. And it fell by a staggering 58%.
That’s a major devaluation for a reserve currency that’s usually valued higher than normal due to the fact that dollars are bought at a higher pace because they’re used for global transactions.
What most people don’t realize is that the U.S. did lead the debt bubble from 1983 to 2008.
The Recipe for Devaluation
There were several factors that caused that sharp devaluation. Total debt in the U.S. grew at 2.54 times its GDP for a span of 25 years and the country experienced near constant trade deficits since 1970. In an effort to compensate these, the largest economy in the world circulated more dollars overseas in foreign exchange reserves.
We flooded our economy and the world with dollars and that is what caused that devaluation of 58% despite the fact that the U.S. was experiencing the greatest boom in the world’s history.
What’s happening now is the beginning of a great deleveraging of the debt and financial asset bubble — the greatest in modern history.
Over the next several years, more dollars will be destroyed than any other currency and that will rebalance the great devaluation of 1985 to 2007. The dollar will continue to go up. Not forever… but at least over the next few years when this deleveraging is likely to be at its worst.
The chart below shows the U.S. dollar index from 2008 to present against the six major currencies of the world.
Facts About the Dollar
So let me ask you this: Has the dollar been crashing? No, it’s been trending up since the last great recession started in early 2008. And it continues to trend up even in this new bubble despite the fact that we’ve printed more and more dollars up until October of 2014.
Why? The European Central Bank (ECB) printed more than we did into early 2012 due to an even greater crisis that has persisted longer for them, and they have started printing again to buy sovereign bonds. In early 2013, Japan went off the reservation printing at two to three times its past rate… outstripping the U.S. And on October 31, they announced an even greater increase of 15% to 20%.
The reason the dollar has appreciated more recently has to do with greater money printing from other governments while we finally tapered for the first time over the last year.
One of the most important insights is that the U.S. dollar has only risen since the great crisis — it’s not falling or crashing. It spiked 27% in the worst of the last great financial crisis of late 2008 when gold crashed 33% and silver 50%. It was the safe haven, not gold and silver.
But now even in the strongest period of the money-printing led recovery, gold has fallen 40% from its peak in 2011 and silver 67%.
Why? All of this money printing has still seen inflation flat to falling in most developed countries and back near deflation levels in Europe. Even Japan’s off-the-charts money printing cannot get inflation back up to a measly 2%.
The recent desperate acceleration of Quantitative Easing (QE) for Japan, and now again in Europe, only reflects the even greater debt problem of those countries and their even slower demographic trends. They’re printing more out of weakness and not out of strength.
So here we are… the best house in a bad neighborhood.
At some point we’ll have to print some money again when our forecasted slowdown of 2015 sets in and there are already many signs of it. But if we do begin printing again, the weaker countries will do it as well and even more so.
The most important observation from the dollar index above is that it’s at a key resistance point around 87 to 89, so if it breaks up it could advance to 104 and ultimately higher. This could possibly happen by late 2016 or early 2017 more or less before trends work against it again.
But the dollar is currently overbought and could correct for days or maybe longer, before it breaks up again. If it does break back up strongly above 89 it will be a sign that commodity prices are trending even lower and that the global economy is slowing even more and that U.S. exports will slow even more.
But a higher dollar will bring greater value to the 50% of earnings of S&P 500 companies that will be worth more in higher valued dollars. That’s the wild card at first.
All things considered, a higher dollar will be a sign that the global slowdown is accelerating and that the great deflation is coming.
So have more in U.S. dollars and safe government bonds… not stocks and commodities. The signal will be if the U.S. dollar breaks much above 89 in the days or weeks ahead.
Harry
Follow me on Twitter @HarryDentjr
Harry studied economics in college in the ’70s, but found it vague and inconclusive. He became so disillusioned by the state of the profession that he turned his back on it. Instead, he threw himself into the burgeoning New Science of Finance, which married economic research and market research and encompassed identifying and studying demographic trends, business cycles, consumers’ purchasing power and many, many other trends that empowered him to forecast economic and market changes.
Copyright © 2014 Harry Dent- All Rights Reserved Disclaimer: The above is a matter of opinion provided for general information purposes only and is not intended as investment advice. Information and analysis above are derived from sources and utilising methods believed to be reliable, but we cannot accept responsibility for any losses you may incur as a result of this analysis. Individuals should consult with their personal financial advisors.
© 2005-2022 http://www.MarketOracle.co.uk - The Market Oracle is a FREE Daily Financial Markets Analysis & Forecasting online publication.