


Stock Market Medium Term Top?
Stock-Markets / Stock Markets 2014 Nov 22, 2014 - 06:49 PM GMTBy: Tony_Caldaro

 Another good week for the market as new all time highs keep this uptrend rising. The market started the week at SPX 2040, rose to 2056 by Tuesday, pulled back to 2040 by Thursday, then rallied to 2071 on Friday. For the week the SPX/DOW were +1.10%, the NDX/NAZ were +0.55%, and the DJ World gained 0.90%. On the economic front it was a positive week. On the uptick: NY/Philly FED, the PPI, NAHB, building permits, existing home sales, leading indicators and the WLEI. On the downtick: industrial production, capacity utilization, housing starts, plus weekly jobless claims rose. Next week, a holiday shortened one, we get Q3 GDP, the Chicago PMI and reports on Housing.
LONG TERM: bull market
The March 2009, Cycle wave [1], five Primary wave bull market continues. Surprisingly this market has already reached a level 31% above the previous all time high in 2007. And, it is the third longest bull market, in months, in the modern era. Only the 1921-1929 and 1987-2000 bull markets had a longer duration. What is also surprising, is that it has been three weeks since the FED ended QE 3 and the market is still rising. This has not occurred before in the entire bull market. Certainly there is a lot of QE-like activity in other countries, but nothing underway or promised by the FED. In fact, many are honing in at the beginning of short term rate increases starting in June 2015.
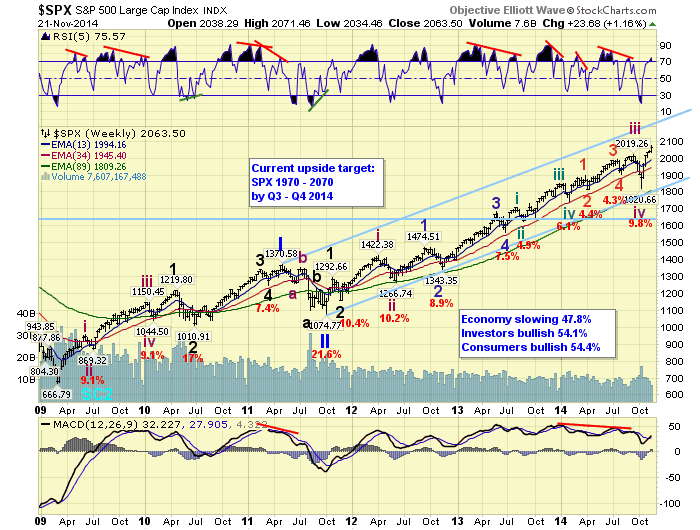
We continue to count Primary waves I and II ending in 2011, and Primary wave III underway since then. Twice, when this market looked like it was about to end Primary III, Q3 2013 and Q3 2014, it extended. You will note in the SPX/DOW/NDX charts, we have upgraded all those charts to an extending Primary III. The NAZ chart is now the only one of the four with the alternate Primary IV: Major A – B count. We have slightly preferred the extending Primary III count for a few weeks now. After tracking this uptrend for five weeks, we do not currently see any signs that it is a corrective B wave. It looks quite impulsive.
MEDIUM TERM: uptrend
This uptrend began in mid-October at SPX 1821. It made quite an explosive advance into early November, and since then has slowed somewhat. In the beginning there were many small degree waves, as the uptrend tried to establish itself. We had a difficult time trying to count all these smaller waves, and decided to just let the uptrend unfold. This is quite unusual. Nevertheless, the market finally settled and we were able to get a decent count. Since then we have been counting five Minor waves up from the SPX 1821 low: 1898-1878-2046-2030-2071.
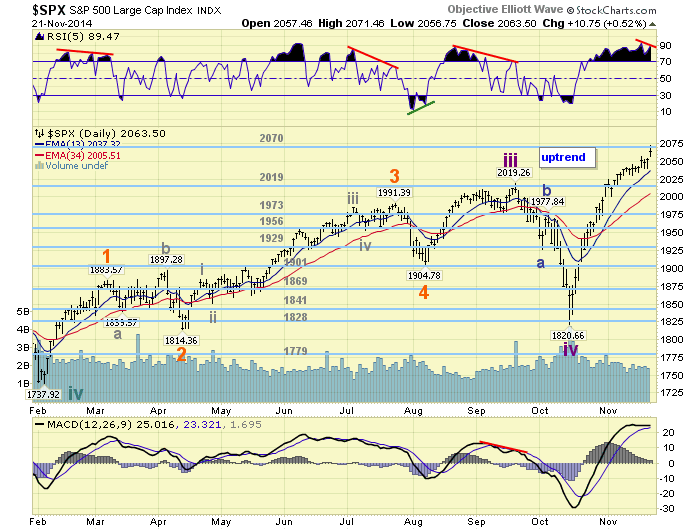
Once this uptrend cleared the 2019 pivot we expected it to continue until the 2070 pivot, and possibly the 2085 pivot. This market hit the 2070 pivot on Friday. Around these pivots we have a cluster of Fibonacci wave relationships, which should act as resistance: 2078, 2082 and 2084. This small six point range locks in the entire advance from the SPX 1075 Primary II low, making it quite important. Should this uptrend break through it, and the pivots, the next pivot is at SPX 2131. Technically, we are still observing negative divergences on the daily NDX/NAZ charts, and now the SPX chart. This, in itself, is a bit of a warning medium term. Medium term support remains at the 2019 and 1973 pivots, with resistance at the 2070 and 2085 pivots.
SHORT TERM
As noted above we see five Minor waves up from the SPX 1821 low: 1898-1878-2046-2030-2071. Minor wave 3 divided into five Minute waves: 2024-2001-2041-2032-2046, and Minor wave 5 appears to be doing something similar: 2056-2040-2071 so far. With Minor wave 3 more than twice Minor 1, and this uptrend having gained nearly 14% in just five weeks, Minor 5 could be quite small. In fact at SPX 2078 Minor 5 would equal 0.618 Minor 1. Since it has already reached SPX 2071 it may unfold in five small waves or even a diagonal triangle. Interesting juncture medium term.
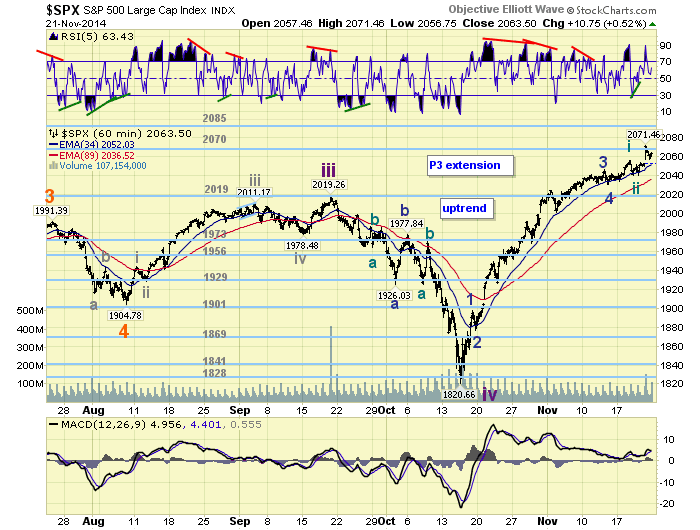
Short term support is at SPX 2040 and the 2019 pivot, with resistance at the 2070 and 2085 pivots. SPX 2040 now looks like a quite important level for this uptrend. Short term momentum ended the week near neutral.
FOREIGN MARKETS
The Asian markets were mixed on the week losing 0.2%.
The European markets were all higher on the week surging 4.6%.
The Commodity equity group were all higher as well gaining 3.9%.
The DJ World index gained 0.9%.
COMMODITIES
Bonds still look like they are in a downtrend finishing flat on the week.
Crude is still in a downtrend but gained 0.8% on the week.
Gold is also in a downtrend but gained 0.8% too.
The USD continues its relentless uptrend gaining 0.9% on the week.
NEXT WEEK
Tuesday: Q3 GDP (est. +3.2%), Case-Shiller, the FHFA index and Consumer confidence. Wednesday: weekly Jobless claims, Durable goods, Personal income/spending, PCE prices, the Chicago PMI, Consumer sentiment, New/Pending home sales. Quite a busy two days. Thursday is a national holiday: Thanksgiving! Happy Thanksgiving, and best to your short trading week!
CHARTS: http://stockcharts.com/public/1269446/tenpp
http://caldaroew.spaces.live.com
After about 40 years of investing in the markets one learns that the markets are constantly changing, not only in price, but in what drives the markets. In the 1960s, the Nifty Fifty were the leaders of the stock market. In the 1970s, stock selection using Technical Analysis was important, as the market stayed with a trading range for the entire decade. In the 1980s, the market finally broke out of it doldrums, as the DOW broke through 1100 in 1982, and launched the greatest bull market on record.
Sharing is an important aspect of a life. Over 100 people have joined our group, from all walks of life, covering twenty three countries across the globe. It's been the most fun I have ever had in the market. Sharing uncommon knowledge, with investors. In hope of aiding them in finding their financial independence.
Copyright © 2014 Tony Caldaro - All Rights Reserved Disclaimer: The above is a matter of opinion provided for general information purposes only and is not intended as investment advice. Information and analysis above are derived from sources and utilising methods believed to be reliable, but we cannot accept responsibility for any losses you may incur as a result of this analysis. Individuals should consult with their personal financial advisors.
Tony Caldaro Archive |
© 2005-2022 http://www.MarketOracle.co.uk - The Market Oracle is a FREE Daily Financial Markets Analysis & Forecasting online publication.