
Crude Oil and Stock Market Setting The Stage For The Next Recession
Stock-Markets /
Stock Markets 2014
Nov 23, 2014 - 06:57 PM GMT
By: Toby_Connor

 After two years of insane money printing designed to rescue its failing economy, Japan has now been rewarded with… another recession.
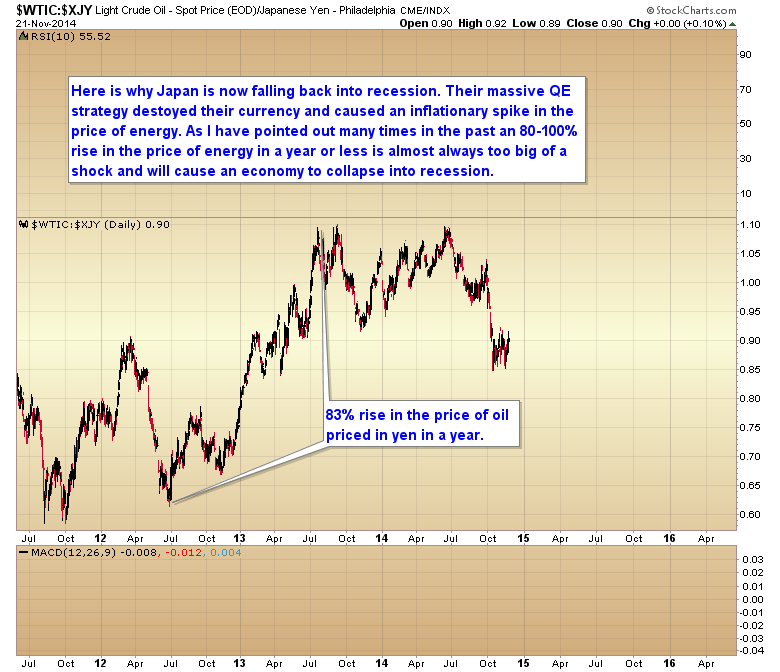
So what went wrong you ask? The same thing that always goes wrong when a central bank resorts to money printing to rescue an economy instead of allowing a cleansing period and a return to real productive growth. All they accomplished with their massive QE program was to spike inflation.
As I have pointed out many times in the past, any time the price of energy spikes 80-100% within a short period of time it will almost always cause a recession. As you can see on the chart below when Japan began their foolish money printing campaign it spiked the price of oil 83% as priced in yen. Add to that the increase in sales tax and ultimately this was just too much for the Japanese economy to withstand, and it has now turned back down into another recession.
Unfortunately all the pieces are falling into place for the Federal Reserve to follow the precedent of the Bank of Japan and ultimately push the US into the next recession. How is that you ask? The economy seems to be rolling along fairly steadily here in the United States.
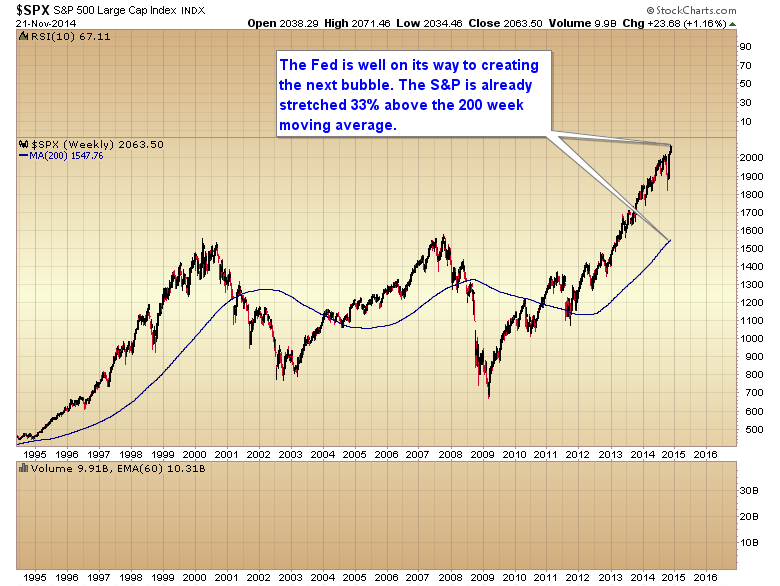
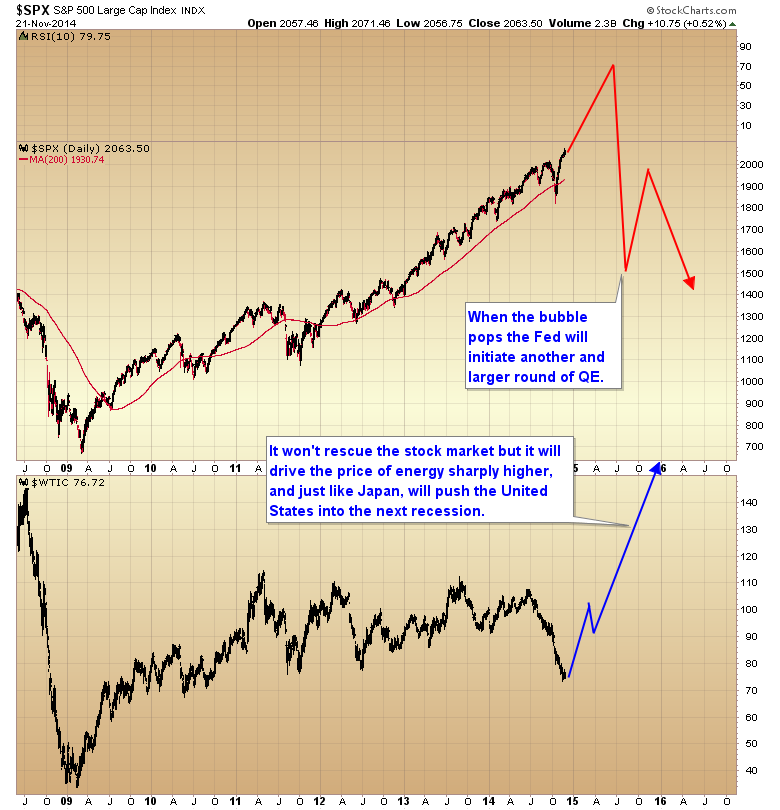
It always starts with the bubble. In the short run Keynesian economic policies work, but the end result is that they create bubbles. In 2000 we had a tech bubble. In 2005/06 we had a real estate bubble. In 2008 we had a bubble in oil and a severe inflationary event (which of course led to a recession). And now in 2014 we are beginning the initial stages of the next bubble. Notice in the chart below that the S&P is now stretched 33% above its 200 week moving average.
Notice how we have very similar conditions to the 1998 period. In 98 the Fed rescued LTCM and sent the signal to the market that the Greenspan put was in place. The market recovered very quickly from the sharp correction and then entered an orgy of speculation with the knowledge that Greenspan would protect the stock market against any serious declines. That culminated in the NASDAQ bubble.
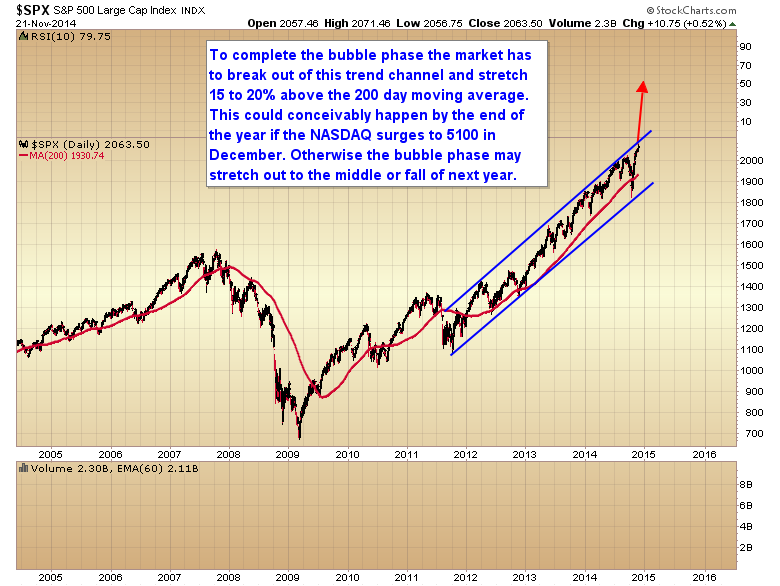
In October the stock market suffered another sharp correction similar to 1998 and again the Fed sent signals that they would restart QE if needed. This caused the market to slingshot back to new highs, and I believe we are now beginning the initial bubble phase that will culminate with the S&P breaking out of its two-year trend channel, and stretching 15-20% above its 200 day moving average. There is even a possibility this could happen quickly if the NASDAQ were to surge straight up to 5100 in the month of December. Otherwise it may take longer and we get our final top sometime next year. Either way, for a bubble to form the market has to stretch a long ways above the 200 day moving average. That is the confirmation that a bubble has formed. We don’t have that yet, and until we do I don’t think we can have a final bull market top.
So how does this cause a recession you ask?
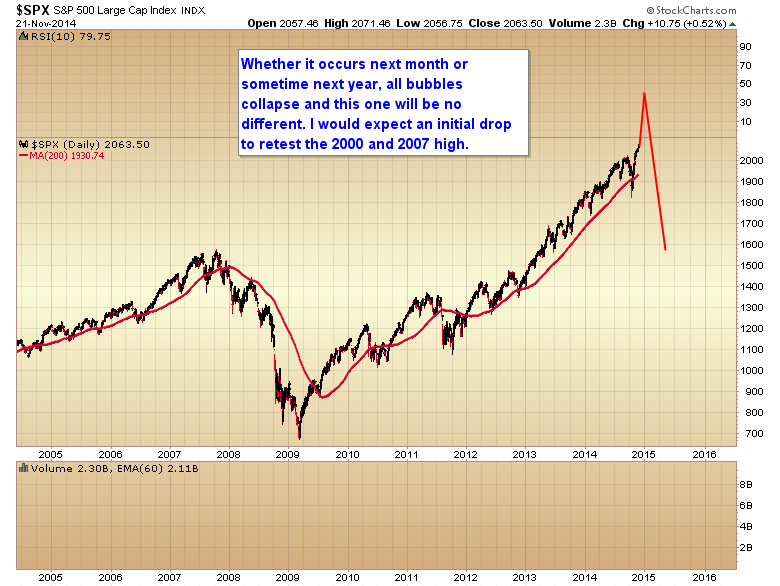
Let me show you how I think this is going to play out in the months and years ahead. At this point the bubble in the stock market is probably unstoppable. The mistakes have already been made and QE to the tune of multiple trillions of dollars is going to have consequences. The bubble in the stock market will continue to rise and grow, until like all bubbles it pops. This is where the plot thickens. I expect the initial crash will take stocks back down to retest the 2000 and 2007 high. I’ve drawn the chart below with the bubble phase occurring next month, but like I said this could easily stretch out into the middle or even fall of next year before the bubble pops. I’ve noted before that it often takes eight months to a year for a bubble to develop and pop. That’s about how long it takes for the public to catch on and every last buyer to enter the market. If we assume that the bubble began at the October low then we could conceivably see this continue until next fall.
Once the bubble pops we all know what the Feds response is going to be. They are going to restart QE and print money at an absolutely mind-boggling rate to try and reflate asset markets. The problem is when a bubble pops, and a parabola collapses, nothing the Fed can do will rescue it. The inflation will come out of stocks and look for something else to land on. Just like it did in 2008 when the stock market topped, the inflation is going to move into the commodity markets, and it will without doubt spike the price of energy at least 100% in a year causing the US economy to follow Japan down into the next recession.
This end game has been unavoidable and unstoppable ever sense the Fed began QE3. When Bullard and Williams went public in mid-October to reassure the markets that more QE would be delivered if needed, it initiated the beginning of the final parabolic bubble phase in the stock market. Now it’s just a question of when will the bubble pop and the terrible consequences of these insane monetary policies begin?
Toby Connor
Gold Scents
GoldScents is a financial blog focused on the analysis of the stock market and the secular gold bull market. Subscriptions to the premium service includes a daily and weekend market update emailed to subscribers. If you would like to be added to the email list that receives notice of new posts to GoldScents, or have questions,email Toby.
© 2014 Copyright Toby Connor - All Rights Reserved
Disclaimer: The above is a matter of opinion provided for general information purposes only and is not intended as investment advice. Information and analysis above are derived from sources and utilising methods believed to be reliable, but we cannot accept responsibility for any losses you may incur as a result of this analysis. Individuals should consult with their personal financial advisors.
© 2005-2022 http://www.MarketOracle.co.uk - The Market Oracle is a FREE Daily Financial Markets Analysis & Forecasting online publication.

