


Crude Oil Price Crash, U.S. Employment and Economic Growth
Economics / US Economy Dec 17, 2014 - 12:22 PM GMTBy: John_Mauldin

 Last week we started a series of letters on the topics I think we need to research in depth as we try to peer into the future and think about how 2015 will unfold. In forecasting US growth, I wrote that we really need to understand the relationships between the boom in energy production on the one hand and employment and overall growth in the US on the other. The old saw that falling oil prices are like a tax cut and are thus a net benefit to the US economy and consumers is not altogether clear to me. I certainly hope the net effect will be positive, but hope is not a realistic basis for a forecast. Let’s go back to two paragraphs I wrote last week:
Texas has been home to 40% of all new jobs created since June 2009. In 2013, the city of Houston had more housing starts than all of California. Much, though not all, of that growth is due directly to oil. Estimates are that 35–40% of total capital expenditure growth is related to energy. But it’s no secret that not only will energy-related capital expenditures not grow next year, they are likely to drop significantly. The news is full of stories about companies slashing their production budgets. This means lower employment, with all of the knock-on effects.
Lacy Hunt and I were talking yesterday about Texas and the oil industry. We have both lived through five periods of boom and bust, although I can only really remember three. This is a movie we’ve seen before, and we know how it ends. Texas Gov. Rick Perry has remarkable timing, slipping out the door to let new governor Greg Abbott to take over just in time to oversee rising unemployment in Texas. The good news for the rest of the country is that in prior Texas recessions the rest of the country has not been dragged down. But energy is not just a Texas and Louisiana story anymore. I will be looking for research as to how much energy development has contributed to growth and employment in the US.
Then the research began to trickle in, and over the last few days there has been a flood. As we will see, energy production has been the main driver of growth in the US economy for the last five years. But changing demographics suggest that we might not need the job-creation machine of energy production as much in the future to ensure overall employment growth.
When I sat down to begin writing this letter on Friday morning, I really intended to write about how falling commodity prices (nearly across the board) and the rise of the dollar are going to affect emerging markets. The risks of significant policy errors and an escalating currency war are very real and could be quite damaging to global growth. But we will get into that next week. Today we’re going to focus on some fascinating data on the interplay between energy and employment and the implications for growth of the US economy. (Note: this letter will print a little longer due to numerous charts, but the word count is actually shorter than usual.)
But first, a quick recommendation. I regularly interact with all the editors of our Mauldin Economics publications, but the subscription service I am most personally involved with is Over My Shoulder.
It is actually very popular (judging from the really high renewal rates), and I probably should mention it more often. Basically, I generally post somewhere between five and ten articles, reports, research pieces, essays, etc., each week to Over My Shoulder. They are sent directly to subscribers in PDF form, along with my comments on the pieces; and of course they’re posted to a subscribers-only section of our website. These articles are gleaned from the hundreds of items I read each week – they’re the ones I feel are most important for those of us who are trying to understand the economy. Often they are from private or subscription sources that I have permission to share occasionally with my readers.
This is not the typical linkfest where some blogger throws up 10 or 20 links every day from Bloomberg, the Wall Street Journal, newspapers, and a few research houses without really curating the material, hoping you will click to the webpage and make them a few pennies for their ads. I post only what I think is worth your time. Sometimes I go several days without any posts, and then there will be four or five in a few days. I don’t feel the need to post something every day if I’m not reading anything worth your time.
Over My Shoulder is like having me as your personal information assistant, finding you the articles that you should be reading – but I’m an assistant with access to hundreds of thousands of dollars of research and 30 years of training in sorting it all out. It’s like having an expert filter for the overwhelming flow of information that’s out there, helping you focus on what is most important.
Frankly, I think the quality of my research has improved over the last couple years precisely because I now have Worth Wray performing the same service for me as I do for Over My Shoulder subscribers. Having Worth on your team is many multiples more expensive than an Over My Shoulder subscription, but it is one of the best investments I’ve ever made. And our combined efforts and insights make Over My Shoulder a great bargain for you.
For the next three weeks, I’m going to change our Over My Shoulder process a bit. Both Worth and I are going to post the most relevant pieces we read as we put together our 2015 forecasts. This time of year there is an onslaught of forecasts and research, and we go through a ton of it. You will literally get to look “over my shoulder” at the research Worth and I will be thinking through as we develop our forecasts, and you will have a better basis for your own analysis of your portfolios and businesses for 2015.
And the best part of it is that Over My Shoulder is relatively cheap. My partners are wanting me to raise the price, and we may do that at some time, but for right now it will stay at $39 a quarter or $149 a year. If you are already a subscriber or if you subscribe in the next few days, I will hold that price for you for at least another three years. I just noticed on the order form (I should check these things more often) that my partners have included a 90-day, 100% money-back guarantee. I don’t remember making that offer when I launched the service, so this is my own version of Internet Monday.
You can learn more and sign up for Over My Shoulder right here.
And now to our regularly scheduled program.
The Impact of Oil On US Growth
I had the pleasure recently of having lunch with longtime Maine fishing buddy Harvey Rosenblum, the long-serving but recently retired chief economist of the Dallas Federal Reserve. Like me, he has lived through multiple oil cycles here in Texas. He really understands the impact of oil on the Texas and US economies. He pointed me to two important sources of data.
The first is a research report published earlier this year by the Manhattan Institute, entitled “The Power and Growth Initiative Report.” Let me highlight a few of the key findings:
1. In recent years, America’s oil & gas boom has added $300–$400 billion annually to the economy – without this contribution, GDP growth would have been negative and the nation would have continued to be in recession.
2. America’s hydrocarbon revolution and its associated job creation are almost entirely the result of drilling & production by more than 20,000 small and midsize businesses, not a handful of “Big Oil” companies. In fact, the typical firm in the oil & gas industry employs fewer than 15 people. [We typically don’t think of the oil business as the place where small businesses are created, but for those of us who have been around the oil patch, we all know that it is. That tendency is becoming even more pronounced as the drilling process becomes more complicated and the need for specialists keeps rising. – John]
3. The shale oil & gas revolution has been the nation’s biggest single creator of solid, middle-class jobs – throughout the economy, from construction to services to information technology.
4. Overall, nearly 1 million Americans work directly in the oil & gas industry, and a total of 10 million jobs are associated with that industry.
Oil & gas jobs are widely geographically dispersed and have already had a significant impact in more than a dozen states: 16 states have more than 150,000 jobs directly in the oil & gas sector and hundreds of thousands more jobs due to growth in that sector.
Author Mark Mills highlighted the importance of oil in employment growth:
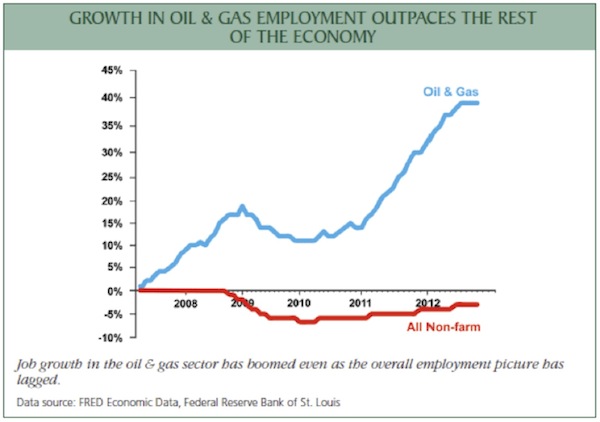
The important takeaway is that, without new energy production, post-recession US growth would have looked more like Europe’s – tepid, to say the least. Job growth would have barely budged over the last five years.
Further, it is not just a Texas and North Dakota play. The benefits have been widespread throughout the country. “For every person working directly in the oil and gas ecosystem, three are employed in related businesses,” says the report. (I should note that the Manhattan Institute is a conservative think tank, so the report is pro-energy-production; but for our purposes, the important thing is the impact of energy production on recent US economic growth.)
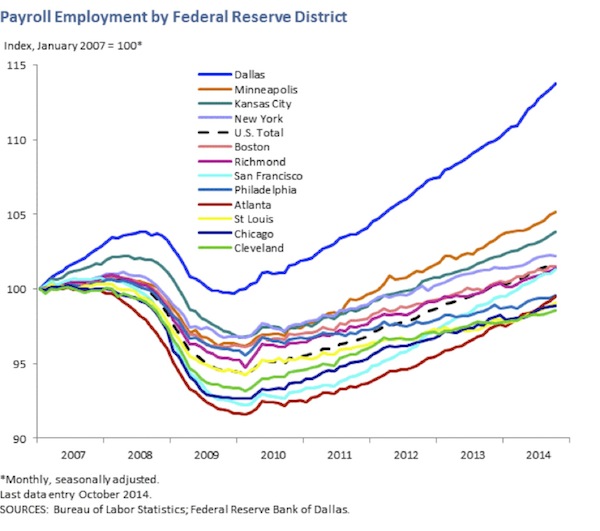
The next chart Harvey directed me to was one that’s on the Dallas Federal Reserve website, and it’s fascinating. It shows total payroll employment in each of the 12 Federal Reserve districts. No surprise, Texas (the Dallas Fed district) shows the largest growth (there are around 1.8 million oil-related jobs in Texas, according to the Manhattan Institute). Next largest is the Minneapolis Fed district, which includes North Dakota and the Bakken oil play. Note in the chart below that four districts have not gotten back to where they were in 2007, and another four have seen very little growth even after eight years. “It is no wonder,” said Harvey, “that so many people feel like we’re still in a recession; for where they live, it still is.”
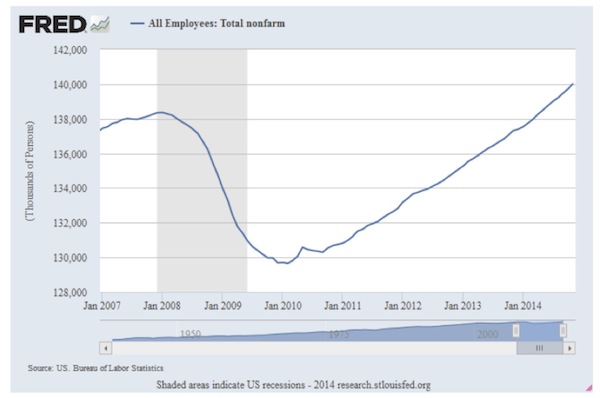
To get the total picture, let’s go to the St. Louis Federal Reserve FRED database and look at the same employment numbers – but for the whole country. Notice that we’re up fewer than two million jobs since the beginning of the Great Recession. That’s a growth of fewer than two million jobs in eight years when the population was growing at multiples of that amount.
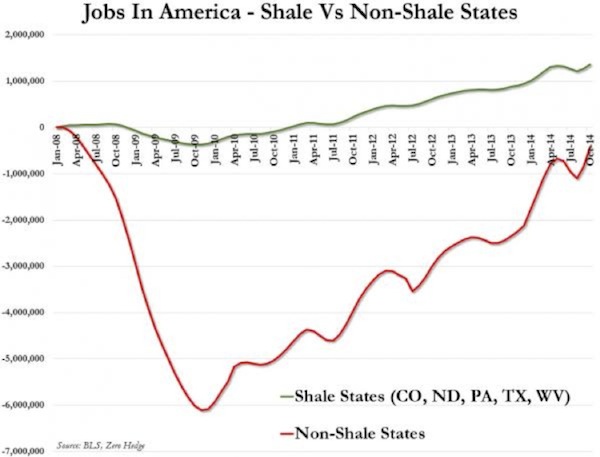
To put an exclamation point on that, Zero Hedge offers this thought:
Houston, we have a problem. With a third of S&P 500 capital expenditure due from the imploding energy sector (and with over 20% of the high-yield market dominated by these names), paying attention to any inflection point in the US oil-producers is critical as they have been gung-ho “unequivocally good” expanders even as oil prices began to fall. So, when Reuters reports a drop of almost 40 percent in new well permits issued across the United States in November, even the Fed's Stan Fischer might start to question [whether] his [belief that] lower oil prices are "a phenomenon that’s making everybody better off" may warrant a rethink.
Consider: lower oil prices unequivocally “make everyone better off.” Right? Wrong. First: new oil well permits collapse 40% in November; why is this an issue? Because since December 2007, or roughly the start of the global depression, shale oil states have added 1.36 million jobs while non-shale states have lost 424,000 jobs.
The writer of this Zero Hedge piece, whoever it is (please understand there is no such person as Tyler Durden; the name is simply a pseudonym for several anonymous writers), concludes with a poignant question:
So, is [Fed Vice-Chairman] Stan Fischer's “not very worried” remark about to become the new Ben “subprime contained” Bernanke of the last crisis?
Did the Fed Cause the Shale Bubble?
Next let’s turn to David Stockman (who I think writes even more than I do). He took aim at the Federal Reserve, which he accuses of creating the recent “shale bubble” just as it did the housing bubble, by keeping interest rates too low and forcing investors to reach for yield. There may be a little truth to that. The reality is that the recent energy boom was financed by $500 billion of credit extended to mostly “subprime” oil companies, who issued what are politely termed high-yield bonds – to the point that 20% of the high-yield market is now energy-production-related.
Sidebar: this is not quite the same problem as subprime loans were, for two reasons: first, the subprime loans were many times larger in total, and many of them were fraudulently misrepresented. Second, many of those loans were what one could characterize as “covenant light,” which means the borrowers can extend the loan, pay back in kind, or change the terms if they run into financial difficulty. So this energy-related high-yield problem is going to take a lot more time than the subprime crisis did to actually manifest, and there will not be immediate foreclosures. But it already clear that the problem is going to continue to negatively (and perhaps severely) impact the high-yield bond market. Once the problems in energy loans to many small companies become evident, prospective borrowers might start looking at the terms that the rest of the junk-bond market gets, which are just as egregious, so they might not like what they see. We clearly did not learn any lessons in 2005 to 2007 and have repeated the same mistakes in the junk-bond market today. If you lose your money this time, you probably deserve to lose it.
The high-yield shake-out, by the way, is going to make it far more difficult to raise money for energy production in the future, when the price of oil will inevitably rise again. The Saudis know exactly what they’re doing. But the current contretemps in the energy world is going to have implications for the rest of the leveraged markets. “Our biggest worry is the end of the liquidity cycle. The Fed is done. The reach for yield that we have seen since 2009 is going into reverse,” says Bank of America (source: The Telegraph).
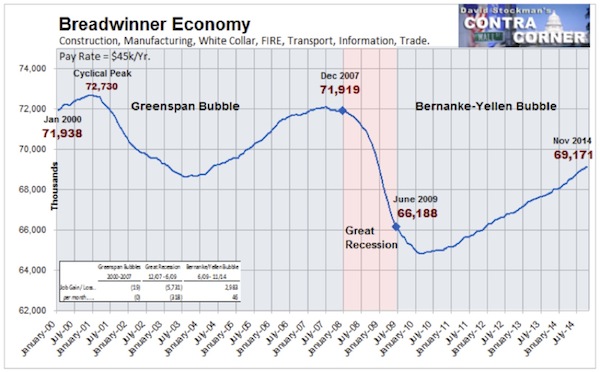
Contained within Stockman’s analysis is some very interesting work on the nature of employment in the post-recession US economy. First, in the nonfarm business sector, the total hours of all persons working is still below that of 2007, even though we nominally have almost two million more jobs. Then David gives us two charts that illustrate the nature of the jobs we are creating (a topic I’ve discussed more than once in this letter). It’s nice to have somebody do the actual work for you.
The first chart shows what he calls “breadwinner jobs,” which are those in manufacturing, information technology, and other white-collar work that have an average pay rate of about $45,000 a year. Note that this chart encompasses two economic cycles covering both the Greenspan and Bernanke eras.
So where did the increase in jobs come from? From what Stockman calls the “part-time economy.” If I read this chart right and compare it to our earlier chart from the Federal Reserve, it basically demonstrates (and this conclusion is also borne out by the research I’ve presented in the past) that the increase in the number of jobs is almost entirely due to the creation of part-time and low-wage positions – bartenders, waiters, bellhops, maids, cobblers, retail clerks, fast food workers, and temp help. Although there are some professional bartenders and waiters who do in fact make good money, they are the exception rather than the rule.
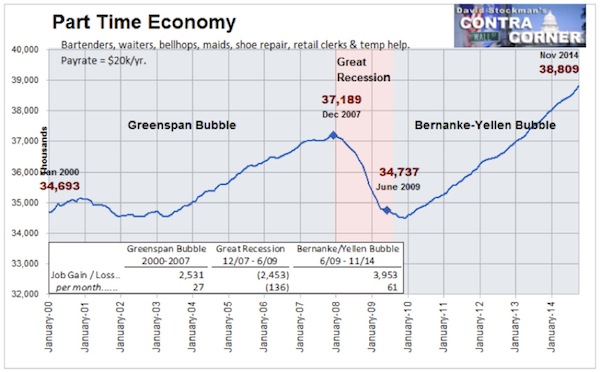
It’s no wonder we are working fewer hours even as we have more jobs.
To continue reading this article from Thoughts from the Frontline – a free weekly publication by John Mauldin, renowned financial expert, best-selling author, and Chairman of Mauldin Economics – please click here.
John Mauldin Archive |
© 2005-2022 http://www.MarketOracle.co.uk - The Market Oracle is a FREE Daily Financial Markets Analysis & Forecasting online publication.