


Will the Crude Oil Price Crash Spell Ruin for Stocks?
Stock-Markets / Stock Markets 2015 Jan 15, 2015 - 03:23 AM GMTBy: Clif_Droke

 Talk of deflation was overheard on the Street as a few analysts quoted by the news wires mentioned the D-word. One reason for the recent equity market weakness is the uncertainty among investors as to whether lower oil prices are ultimately beneficial or detrimental for the economy. In one camp are those who maintain that lower oil prices will boost consumption; on the other side are those who claim that plummeting energy prices can only lead to outright deflation. Because neither side has a decisive majority right now, equities are caught in the imbalance of opinion which explains much of the recent volatility.
Adding to the uncertainty this week was the latest research note from Goldman Sachs. Goldman’s chief commodities analyst Jeffrey Currie wrote: “To keep all capital sidelined and curtail investment in shale until the market has re-balanced, we believe prices need to stay lower for longer.” Goldman made a high-profile call for $40/barrel oil before the bottom has been seen in the crude market.
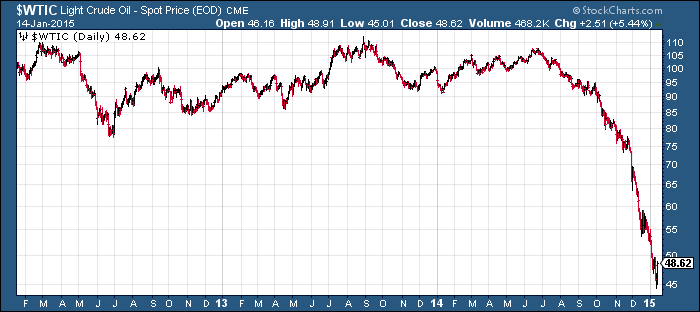
Both sides of the argument have merit, but history shows that there comes a point at which falling oil prices eventually exert a negative on equities. The two examples that come to mind are the 2008 oil collapse, which increased downside volatility for the credit crisis. Before that, the 1998 plunge, which took crude prices below $10/barrel, aggravated the Russian Ruble crisis and LTCM hedge fund collapse of that year and had a decidedly negative spillover impact on stock prices for a while.
I would also point out that in the Kress cycle forecast for 2015 the 6-year “echo” suggests that the first few weeks of the New Year could be negative for stocks. The Kress cycle echoes tend to be fairly accurate in warning of broad periods of above-average volatility and of the years which most closely align with 2015 in terms of the key Kress cycles, January was shown to be a particularly vulnerable month for selling pressure.
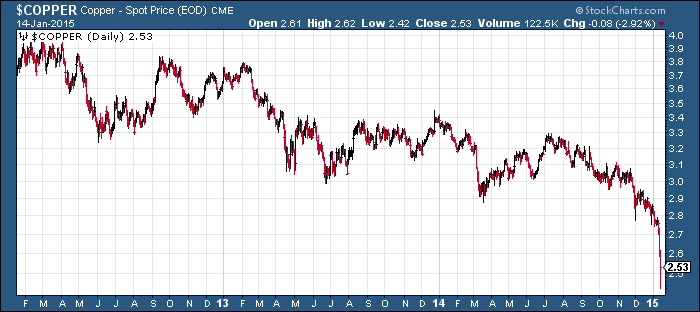
Meanwhile commodities continue to take center stage as concerns mount that the weakness in the energy market may spill over into other areas of the financial system and the economy at large. On Wednesday, Citigroup cut its iron ore and coal forecasts due to supply costs and signaled that the oil price crash is feeding into other commodity markets. An even bigger sign that that weakness is having an impact on global demand can be seen in the chart for copper futures. Copper is a widely watched gauge of global economic strength and the following graph suggests diminishing demand.
One of the major culprits for the weakness in oil and other commodities is the austerity policies in Greece and other euro zone countries, which is coming home to roost right now. While the U.S. Federal Reserve responded to the unmitigated demand for money during the critical years 2009-2012, other countries chose to ignore the need for increased reserves and liquidity and instead initiated an ill-timed tight money policy. Fast-forward to 2015 and while the U.S. finds itself the envy of the world in terms of its domestic economy, other nations are showing major signs of weakness with some verging on recession.
The risk is that the commodities bear market continues exerting a negative influence on economies in Europe and Asia with weakness eventually being exported to the U.S. This is what happened, on a temporary scale at least, in 1998. While we’re a long way from the danger zone, there are preliminary signs that some of that weakness is already showing up. The latest U.S. retail sales numbers, for instance, showed a 0.9 percent drop for December in what should by all accounts have been a positive month. Electronic and clothing retailers were among the nine of the 13 leading categories that showed a decline in sales as Americans chose not to spend the extra money from gasoline price savings.
A better reflection of what the average consumer is doing with his money is visible in the New Economy Index (NEI). NEI is a basket average of several stocks within the consumer retail and business sectors. For years it has provided an accurate real-time picture of the overall state of the U.S. retail economy. Here’s what the NEI looks like right now.
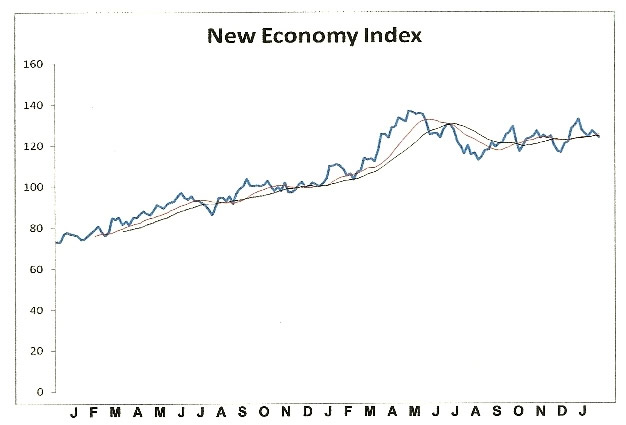
NEI reached an all-time high last January and has spent the past year consolidating its gains since 2009 by tracing out a lateral range. The NEI chart looks decent but could certainly use some improvement. My interpretation of the NEI pattern is that while consumers have been spending at moderate levels, they haven’t completely “let loose” with those frenetic spending binges that have always characterized strong economies of the past.
Although joblessness isn’t a major problem like it was in years past – the latest jobs report showed a surge of 321,000 new jobs in November – consumers are apparently concerned enough about keeping their jobs that they haven’t accelerated their spending. It will be interesting to see how they respond to the continued weakness in the commodities market.
Mastering Moving Averages
The moving average is one of the most versatile of all trading tools and should be a part of every investor's arsenal. The moving average is one of the most versatile of all trading tools and should be a part of every investor's arsenal. Far more than a simple trend line, it's a dynamic momentum indicator as well as a means of identifying support and resistance across variable time frames. It can also be used in place of an overbought/oversold oscillator when used in relationship to the price of the stock or ETF you're trading in.
In my latest book, "Mastering Moving Averages," I remove the mystique behind stock and ETF trading and reveal a completely simple and reliable system that allows retail traders to profit from both up and down moves in the market. The trading techniques discussed in the book have been carefully calibrated to match today's fast-moving and sometimes volatile market environment. If you're interested in moving average trading techniques, you'll want to read this book.
Order today and receive an autographed copy along with a copy of the book, "The Best Strategies For Momentum Traders." Your order also includes a FREE 1-month trial subscription to the Momentum Strategies Report newsletter: http://www.clifdroke.com/books/masteringma.html
By Clif Droke
www.clifdroke.com
Clif Droke is the editor of the daily Gold & Silver Stock Report. Published daily since 2002, the report provides forecasts and analysis of the leading gold, silver, uranium and energy stocks from a short-term technical standpoint. He is also the author of numerous books, including 'How to Read Chart Patterns for Greater Profits.' For more information visit www.clifdroke.com
Clif Droke Archive |
© 2005-2022 http://www.MarketOracle.co.uk - The Market Oracle is a FREE Daily Financial Markets Analysis & Forecasting online publication.