


Don't Let This Stock Market Myth Cost You Your Gains
Stock-Markets / Stock Markets 2015 Feb 28, 2015 - 12:39 PM GMTBy: Money_Morning

 Keith Fitz-Gerald writes: Amazon, Apple, Cisco, Barnes & Noble, and hundreds of other companies are at fresh 52-week highs, leading many investors to question the wisdom of putting more money to work.
Yet that’s exactly what you should be doing.
I know it seems counter-intuitive – especially if you believe in buy low and sell high like I do – but here’s the thing…
…the markets are always making new highs.
It’s how you deal with them and how you pick the companies with the potential to go even higher that separates the winners from the losers.
I’m going to prove that to you right now.
And then I’m going to show you three tactical criteria you can use to judge for yourself whether something you want to buy “makes the grade.”
Here’s why market highs alone can’t be a deal-breaker for you.
Market Highs Are the Norm
People tell me all the time that they don’t want to buy anything, especially with the markets near all-time highs. I get where they’re coming from.
But here’s the thing.
The markets are almost always at or near all-time highs. That’s how they work. Over time there’s a very powerful upward bias that mirrors the amount of capital that’s constantly chasing quality companies.
To put this in perspective, consider that according to Ric Edelman, president of Edelman Financial, the markets achieve new highs – on average – roughly once every 18 days.
I know that sounds like a loaded statement and you’re right… it is. But I am sharing this with you for a reason – even the lows of 2003 and 2008 were all-time highs compared to the markets in 1990 or 1972. It’s your perspective that changes.
My point is that the overwhelming majority of people who try to time the markets based on a combination of emotion and whether they think it’s high or low usually wind up getting it backward.
Not surprisingly, they doom themselves to pitiful returns.
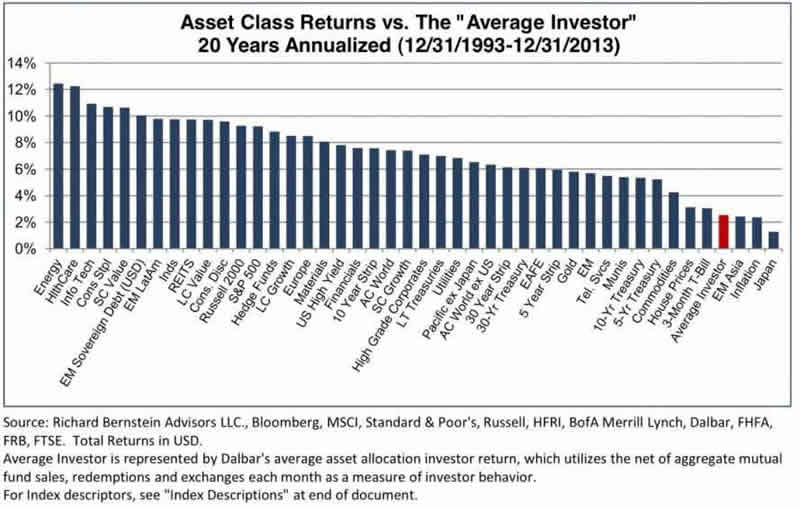
From 1993 to 2013, for example, the average individual investor trying to guess which direction things were going performed so poorly that they lagged behind every asset class save three: EM Asia, inflation, and Japan.
Consider Altria Group Inc. (NYSE:MO).
I recommended the company on February 23, 2010, and got more than a few questions from incredulous observers and some readers wondering if I’d finally lost my marbles.
Turns out that folks weren’t concerned with the fact that big tobacco was under tremendous legal pressure. Nor did they care that anti-smoking groups were gaining ground and threatening revenues.
No… what troubled most readers and analysts even more was the fact that Altria was only pennies away from 52-week highs. To their way of thinking, the fact that it was tapping new higher prices meant that the stock was ready for a fall.
Obviously that didn’t happen. Since then the stock has returned 267%. By comparison, the S&P 500 and Dow have tacked on still impressive, but much smaller, gains of 94% and 77%, respectively.
The Downfall of Market-Timers
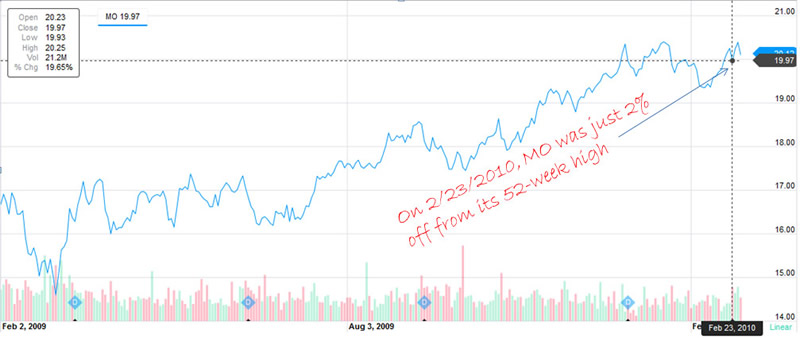
Source: Yahoo!Finance
Market-timers fail because they let emotional input override logical information. That’s why the fear of buying right before seeing a stock float back to earth stops them making sound investment decisions.
Do you really want to let your wealth suffer like that? Not if I can help it.
The harmful effects of letting emotion determine your investing decisions has been well-documented. According to DALBAR, the average investor who let emotion guide him saw an annual return of 1.9% in the 20 years before 2009, while the S&P 500 averaged 8.4% annually in the same period.
More recent figures are no better. The latest DALBAR research shows that the average investor saw annual gains of 5.02% for the 20 years leading up to 2014, even as the S&P 500 returned 9.22% annually. That’s serious underperformance rooted in emotion.
Investors who shy away from stocks that are pushing yearly highs based just on their price are forgetting one of Warren Buffett’s greatest observations: It’s better to buy a fantastic stock at a fair price than it is to buy a fair stock at a fantastic price.
I couldn’t agree more.
How to Determine Real Discounts
None of this is to say that I don’t value stocks that are cheaper than they should be. I hunt for them every day, whether the markets are tapping new highs like they are now or plumbing new lows like they were in 2003 and again in 2008.
You just need to know how to recognize the entry points.
My favorite tool is the humble P/E ratio. Also known as a price multiple, it’s a handy measure tracked by every major internet investing site of note and a quick way to gauge whether or not a stock you’re interested in is “expensive” or “cheap.”
In Altria’s case, I recommended it when it was trading at 12.56 times the prior four quarters’ worth of earnings. That might seem steep, especially considering the fact it was near its 52-week high, but to me it signified future upside. The reason? The 12.56 P/E ratio actually represented a 35% discount from the S&P 500′s average P/E at the time.
Some analysts like to look at the forward P/E ratio, which uses forecasted earnings to calculate the relative price appeal of a stock price. Altria’s forward P/E ratio was an even more attractive 9.59 when I recommended it – more proof to me that the company had profitable days ahead.
There’s also the Price/Earnings to Growth (PEG) ratio. I like the “peg” because it can tell you a lot about how the markets are valuing the company versus its earnings growth rate. PEG readings lower than 1 suggest the price is attractive, while readings higher than 1 suggest you are paying a premium for earnings growth. But again, context is important.
In February 2010, Altria was coming off a period of average annual earnings per share growth of 9.7%, making its PEG ratio equal to 12.56 divided by 9.7, or 1.3. That figure was confirmation to me that the stock was rising in line with its growth prospects, and not above it even though the market already thought it “rich.”
What about a contemporary example?
No doubt you know that Apple Inc. (NasdaqGS:AAPL) is on a tear.
The stock has tacked on some $75 billion since early February, and its total market capitalization now stands at $760 billion. Anybody thinking about buying has to be asking themselves this question: “Am I getting a good deal at these prices?”
The numbers suggest you are if you’re a long-term investor.
Apple boasts a P/E ratio of around 17 today… which is barely half that of the industry average, according to Yahoo!Finance. When accounting for forecasts up through the 2016 fiscal year, forward P/E is a respectable 14.07. The PEG ratio is 1.17.
In other words, it may still be very much a “Buy” despite its recent surge in price.
The Ultimate Litmus Test
At the end of the day, the stock market is filled with ups and downs, so there’s no way to predict with absolutely certainty that a company’s performance will continue. Or that it won’t.
Ultimately, you’ve got to a) remove emotion from the process and b) make decisions based on logic.
Even if what you want to buy is making yet another 52-week high.
Until next time,
Keith
Source :http://totalwealthresearch.com/2015/02/dont-give-260-gains-market-myth/
Money Morning/The Money Map Report
©2015 Monument Street Publishing. All Rights Reserved. Protected by copyright laws of the United States and international treaties. Any reproduction, copying, or redistribution (electronic or otherwise, including on the world wide web), of content from this website, in whole or in part, is strictly prohibited without the express written permission of Monument Street Publishing. 105 West Monument Street, Baltimore MD 21201, Email: customerservice@moneymorning.com
Disclaimer: Nothing published by Money Morning should be considered personalized investment advice. Although our employees may answer your general customer service questions, they are not licensed under securities laws to address your particular investment situation. No communication by our employees to you should be deemed as personalized investent advice. We expressly forbid our writers from having a financial interest in any security recommended to our readers. All of our employees and agents must wait 24 hours after on-line publication, or after the mailing of printed-only publication prior to following an initial recommendation. Any investments recommended by Money Morning should be made only after consulting with your investment advisor and only after reviewing the prospectus or financial statements of the company.
Money Morning Archive |
© 2005-2022 http://www.MarketOracle.co.uk - The Market Oracle is a FREE Daily Financial Markets Analysis & Forecasting online publication.