


Stock Market Pull Back Expected: What's Ahead?
Stock-Markets / Stock Markets 2015 Mar 09, 2015 - 12:25 PM GMTBy: Brad_Gudgeon

 Last week I wrote that I believed that the 20 week cycle low would take the S&P 500 to near 2008/09 by March 6. We closed Friday at 2071 and look likely to go lower into next week. As it stands now, I believe I was 4 trading days off in my calculations. The ideal 100 trading day low is due Thursday March 12 right on the Bradley turn (we never know whether a "Bradley Siderograph" turn will be a high or low). Seldom is the 100 trading day cycle low ideal either because it has a tolerance of about 15% either way.
Market forecasting is much like forecasting the weather, the closer we are, the easier it is to forecast. I like to look at all the possibilities going forward and eliminate the ones that are unlikely as time moves on. It used to be much easier to forecast based on Elliott Waves when we were in a 5 wave bull market, but as I stated last week, I have not seen any true 5 wave sequences since early 2000 (even the 10/20/40 week cycles used to be fairly predictable back then [1980's to 2000], but all that has changed).
October 15, 2014 ended a 40 wk low from February 5, 2014. What made it difficult to trade last year is that the 10 wk low from February 2014 to early April came right on target, but there was no discernible 20 week low to be found anywhere within the normal parameters of what a 20 wk low should do! It came in early June and was barely a dip-blip on the screen.
Now we have adjusting lows. The 10 wk low from October 15, 2015 arrived on trading day 43 (50 trading days 15%) December 14, 2014. The February 2, 2015 low is now a dominant low because it is unlikely that the expected low next week will go below SPX 1980/81, but closer to 2013/15, making this wave down wave 'b' of an a-b-c type rally (as I expected based on e-wave projections). There should now be an adjusting 10 wk low due in April from the Feb 2, 2015 low.
The chart below of the S&P 500 shows what I expect next week. Notice the green arrow. Also, notice the similarity to the December drop into the 10 week low. The white 21 day exponential moving average line bent down back then and the next day we saw a strong rebound rally that couldn't hold. Calculating the point drop back in December to current, I was able to ascertain early on in the day that we would hold SPX 2067 and that is indeed what happened.
In December, the SPX fell 106 points top to bottom. The current projection allows for a move to 2015 or a drop of 104 points from the top at 2119. The expected rally Monday (which is also an 8 trading day top) should make it anywhere between 2096 to 2098 and then fall 83 point into Thursday (back in December we topped on a 4 trading day cycle top). The March 9th rally should be fierce and fast (about 2.5 hrs total).
On Traders-Talk it was noted that the ISEE reading of put/call ratio was extremely high Thursday and we also had a low TRIN reading Friday on the sell-off (meaning the declining volume did not support such a move), all of which should support a strong counter trend rally Monday (Mark, the gentleman who runs the sight, also had some of his personal readings suggesting a rally soon within a few day of last Thursday).
I have extended out to what I believe will happen into the expected top due on an e-wave basis around March 23/24 (the 16 trading day top is due on March 19 4 trading days). If the market rallies like we did in December, then we might expect a move to SPX 2134-36. 2131 would be minimum based on the rising tops line.
The forecast extension out into April is just one scenario, but right now... my preferred scenario (this could change as data changes). The issue going forth is when in April will the low come? I have late April on the scenario as the coming low, but believe it will be slightly sooner.
S&P500 Chart 1
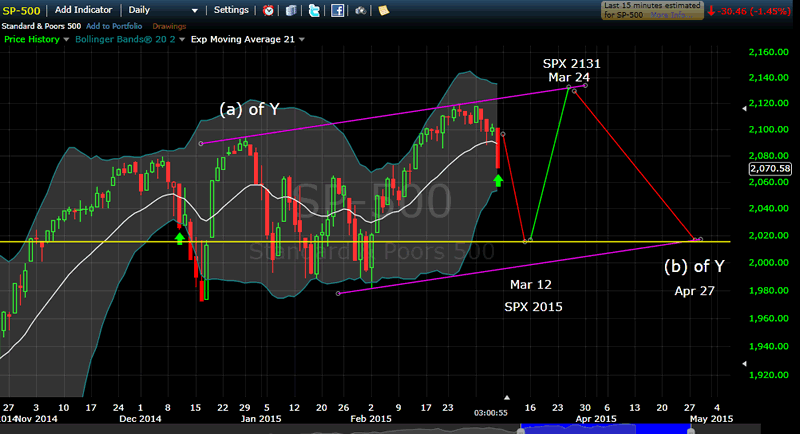
The outlined magenta "bull flag" formation could be pushed a little higher if we touch 2134-36 on the rebound wave bringing the lower line up higher as well. As the expected rebound rally will be wave 'c' of an a-b-c type rally, it should be taken out into April as we complete wave (b) of Y in wave [z].
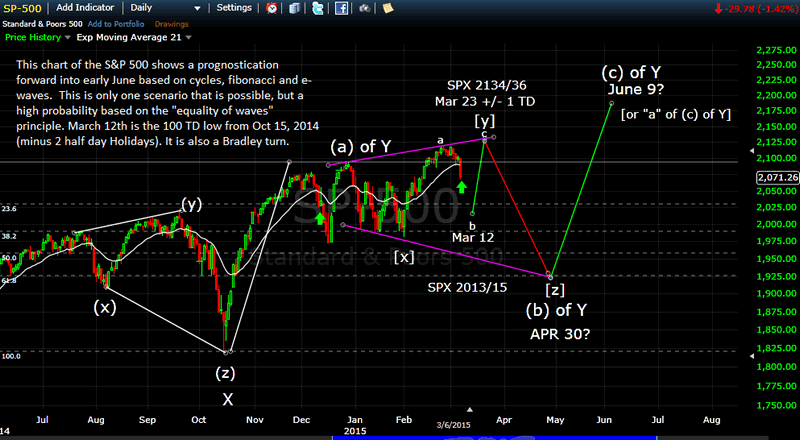
The chart below explains an alternate and unexpected (but viable) scenario and that is a much deeper correction ala Sept/October 2014 into the low 1900's. I have noted the e-wave structure in the chart, which goes with either scenario.
I have April 30th as the expected low on this chart, but believe it to be too far extended into the future (as it should be around the 20th). If this scenario happens, I would have to rethink when the final "Z" wave low would occur, because we would have about 6 months between 2 major corrections of about 10%, which would push out any final low until late October.
I have never seen an "Irregular Megaphone" (see last weeks' article) of this size before, and anything resembling the scenario below would likely have a double top in place before having a crash of the immenseness I'm expecting (22-24%).
S&P500 Chart 2
As events unfold, my subscribers receive updates and adjustments that are not possible on a weekly basis. The key to market profits is being able to adjust to conditions as they develop and then take advantage of them. Friday March 6, 2015 was a key day.
Brad Gudgeon
Editor of The BluStar Market Timer
The BluStar Market Timer was rated #1 in the world by Timer Trac in 2014, competing with over 1600 market timers. This occurred despite what the author considered a very difficult year for him. Brad Gudgeon, editor and author of the BluStar Market Timer, is a market veteran of over 30 years. The website is www.blustarmarkettimer.info To view the details more clearly, you may visit our free chart look at www.blustarcharts.weebly.com Copyright 2015. All Rights Reserved
Copyright 2015, BluStar Market Timer. All rights reserved.
Disclaimer: The above information is not intended as investment advice. Market timers can and do make mistakes. The above analysis is believed to be reliable, but we cannot be responsible for losses should they occur as a result of using this information. This article is intended for educational purposes only. Past performance is never a guarantee of future performance.
© 2005-2022 http://www.MarketOracle.co.uk - The Market Oracle is a FREE Daily Financial Markets Analysis & Forecasting online publication.