


Weekly Gold and Silver Technical Analysis Report - 11th March 2007 - Technically Precious with Merv
Commodities / Gold & Silver Mar 11, 2007 - 02:15 PM GMTBy: Merv_Burak

The week started on a downer and ended on a downer. Gold is trying to recover from the plunge but is finding difficulty. Which way next? Let's see.
Before going into the regular routine I though I would once more say a few words about MOMENTUM as so many are really not that sure what it is or what to do with it.
MOMENTUM (MOM)
When hearing or reading a commentator (or analyst) mention the word “momentum” I can say with all certainty that most readers do not REALLY know what the commentator is really referring to. The commentator in all likelihood doesn't really know himself but it sounds intelligent. Could it be earnings momentum or sales momentum or what have you momentum? Unless the commentator defines in simple terms what he is referring to, who knows, really?
When I mention momentum, I am referring to the momentum (or strength) of the recent price activity compared to the price activity over some specified period of time. In my commentaries I favor the use of an indicator called the Relative Strength Index (RSI). Readers will recall my use of a 50 Day RSI or a 30 Week RSI or others. These reflect the strength of recent price activity versus the activity over the previous 50 days or 30 weeks, etc. Of these two one is my momentum indicator reflecting strength for the intermediate term period and the other is for a long term period. By adjusting the number of days or weeks one can develop a momentum indicator for any time period one may wish.
But SO WHAT, you may ask. What good is it?
Momentum indicators (and there are literally dozens of them) are used by myself as early warning indicators of potential trend change. The ONLY reason one develops a momentum indicator, in my view, is as an indicator to provide this early warning so that one may be on guard for a change in price direction. They can also confirm that a change of trend, determined by some other indicator such as the moving average indicator, has actually occurred.
One would not act on the message of the momentum indicator alone but would use it in combination with other indicators for a consensus before acting. Although there are always exceptions to the rule one would expect the strength of recent price activity to show up first in short term momentum indicators and then progressively to longer term indicators. As mentioned, they provide advance warning of potential price change. Price trends do not normally turn on a dime. They get progressively weaker and weaker (or stronger and stronger) over time before reversing. This is generally true at market tops and market bottoms.
One should not jump to conclusions with these indicators. As a warning indicator of potential change in price trend all the indicator is telling you is that the recent price action is getting weaker or stronger relative to the time period chosen. During any trend the price activity may, at times, slow down or speed up but neither is cause for real concern, but are cause for being on guard. It is not unusual for a price to double or more over time, all the while the momentum is getting weaker and weaker. The fact that the indicator is getting weaker is not, by itself, a reason to panic.
Most momentum indicators are like the RSI. They have a neutral level, usually a zero or a 50% level. The indicator then oscillates above and below this neutral level. Taking the RSI as I use it, if the RSI is above its neutral level it is rated as positive. If it is below the neutral line it is rated as negative. Within each zone, if the direction of the indicator is upwards it is strengthening, if the direction is downwards it is weakening. As you can see the indicator could be weakening but still rated as positive by remaining above its neutral line. The strengthening or weakening is a warning, the crossing of the neutral line is a confirmation of trend change that was determined by a trend indicator. The momentum indicator may often precede the trend indicator in giving trend reversal notification. See the chart below for the momentum trend change in early 2001 prior to the long term moving average changing direction.
GOLD : LONG TERM
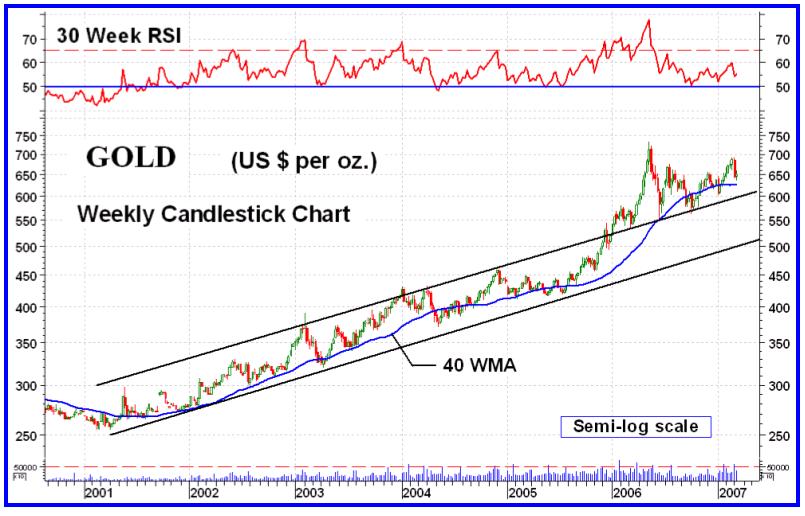
I have shown this long term chart many times before. It is a weekly semi-log scale chart with a 30 Week RSI momentum indicator. I should mention that I am possible alone in the way I use the RSI. Most analysts would use a short term RSI, such as a 9 or 14 day RSI, regardless of the time period analysis they are performing. This is possibly because these are the most common default settings in most technical software packages. Maybe I am doing something wrong but I doubt it. I am looking for confirmation of trend for the respective time period and only a longer term RSI (or any momentum indicator) will give me that. Looking at the 30 Week RSI in the chart one can see that once the indicator went decisively positive in mid to late 2000 it has stayed positive except for one very brief period in 2004.
As for what it is telling us right now, well it is still in the positive zone but with very low strength value. It is a lot closer to dropping into the negative than it is reaching into new highs. If we look back at previous rallies into new highs we see the indicator quite robust, well above the 60% level, although not always making new highs with the price. As the price has been making new recovery highs recently the indicator was showing momentum weakness in the move by staying well below the 60% mark. This weakness in price momentum (strength), if not improved, could result in further lateral trending of the price or even a more severe down turn than we have experienced. It would not be a surprise to see the price move back inside its long term up trending channel and continue within the channel. For now the upper channel trend line is acting as a support line. Should the price break below this trend line it will once more revert to its resistance task.
As for the other indicators, the action remains above its long term moving average line with the line slope still positive but only very slightly so. A move by the price to below the $620 level could cause the moving average line to turn downwards once more. The one indicator that continues to show strength is the cumulative volume indicator, the On-Balance Volume. It remains above a support level that has been well established from 9 months of activity.
The long term P&F chart has remained unchanged from last week so it remains bullish and a long way from any P&F reversal. All in all, although the indicators are all in their positive zones the weakness in the recent action causes me to remain in the NEUTRAL camp for another week.
INTERMEDIATE TERM
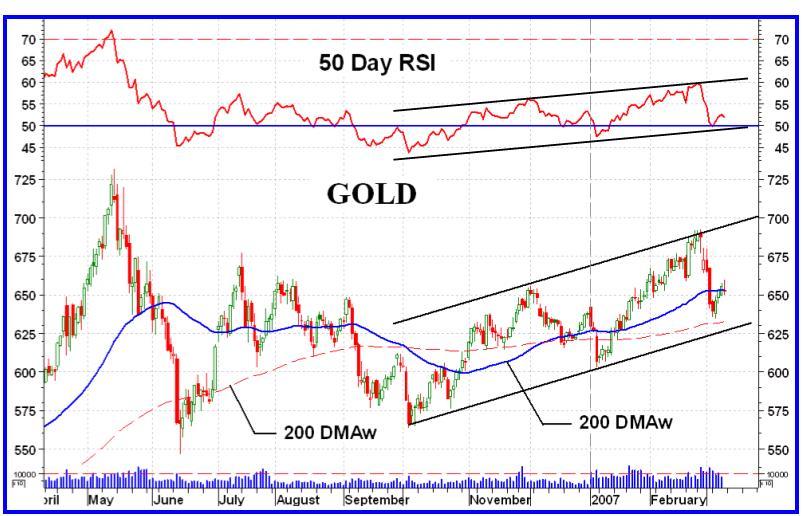
Unlike the long term chart where the momentum indicator has stayed in the positive zone for years the intermediate term momentum has been quite volatile these past 9 months crossing its neutral line several times in the process. This is a normal situation where we have an extended lateral trend in the price and causes technicians to get very frustrated.
We have the price once more below a negative intermediate term moving average line while at the same time the momentum indicator remains in its positive zone, but only barely. Since the price and momentum made their lows in early Oct they have both established up trending channels and remain inside their respective cannels. They are at their low ends of the channel so we should either get a rally from here or we could break below the channel.
There being no significant change in the indicators from last week I will remain with my BEARISH position on the intermediate term.
SHORT TERM
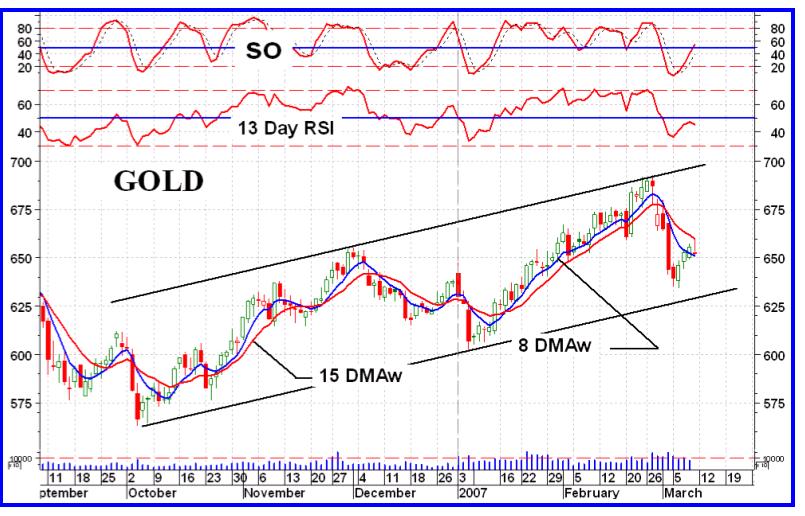
Since the sharp down turn several days ago the short term prognosis has been quite negative. It remains so despite the rally during the middle of last week. We are still below a negative short term moving average line. The action on Friday just touched the line and reacted lower. Short term momentum, represented by the 13 Day RSI, remains in its negative zone with a failed rally starting to turn down again. We have seen some heavy volume days recently but it seems that the heavier volume days have been ones associated with lower prices, which is not usually a bullish indication. From this I remain BEARISH on the short term and expect lower prices ahead.
IMMEDIATE TERM
Ah! The flip of the coin period. What to expect over the next day or two. The Friday\s action suggests a reversal day. In the candlestick analysis this could be called a “long upper shadow” or a “shooting star”, I'm not sure which is more appropriate. In any case, both are considered one day bearish patterns in an up trend, which one can assume the previous 3 days were. Although the price crossed the very short term moving average line on the up side on Thursday, and remains just above the Friday close, the line slope remains in the downward direction so we should expect a cross over back to the down side. The Stochastic Oscillator (a more aggressive momentum indicator) has been rallying with the price and has entered its positive zone but this indicator could reverse very fast. I will go with the moving average and “shooting star” and look for more down side action on Monday and possibly Tuesday.
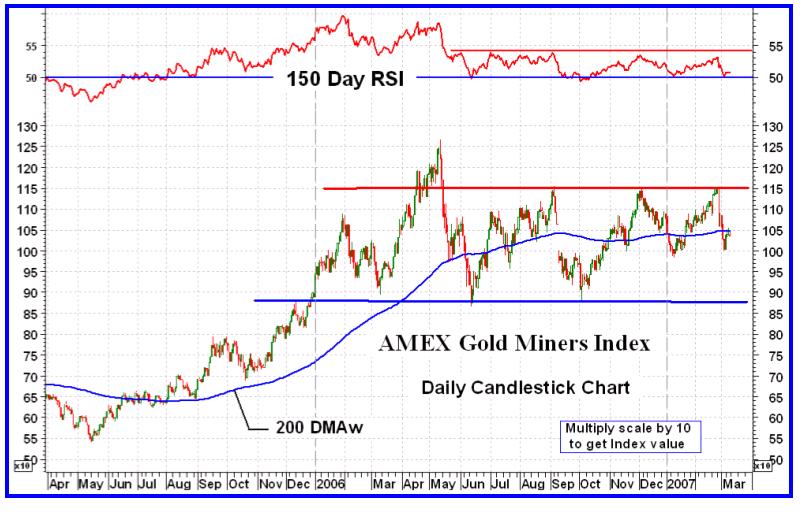
NORTH AMERICAN GOLD INDICES
Well we are back to the AMEX Gold Miners Index this week (see chart on the next page). We continue with an elongated right shoulder of a head and shoulder pattern. Until this action breaks above the red resistance line technicians are bound to consider this still a valid head and shoulder. I think it is much too heavy on the right and the time for a head and shoulder has passed. However, that does not mean that the previous neckline, now a support line, cannot be breached. That still seems like the most likely scenario. We have a very weak but still slightly positive long term momentum along with an Index that is slightly below a negative moving average line. Although the Index is at about the mid point of its several month trading range its long term momentum is very near its lower level. Weakness in the Index action.
This Index must be considered as NEUTRAL in its trend until it decisively breaks above its resistance or below its support lines.
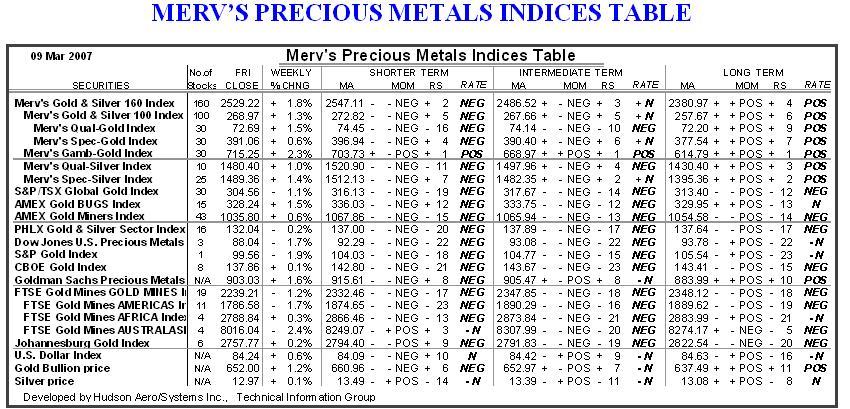
MERV'S PRECIOUS METALS INDICES
Once again it was a plus week for the Indices. The overall Merv's Composite Index of Precious Metals Indices closed higher but by so little that it barely can be seen on the chart. All of Merv's Indices closed on the up side while only 2 of the 4 major North American Indices closed higher. The Composite Index is sitting in between the negative intermediate and positive long term moving average lines. Momentum wise, both are in their positive zones but both are showing weakness in the price action. We may be in for more rough times ahead for these Indices.
MERV'S GOLD & SILVER 160 INDEX
Following the sharp sell-off of last week the universe of 160 recovered somewhat this week. The 1.8% advance doesn't look like much but it was one of the better performers of the Indices in the Precious Metals Table. It was not enough, however, to reverse the short term rating into the positive.
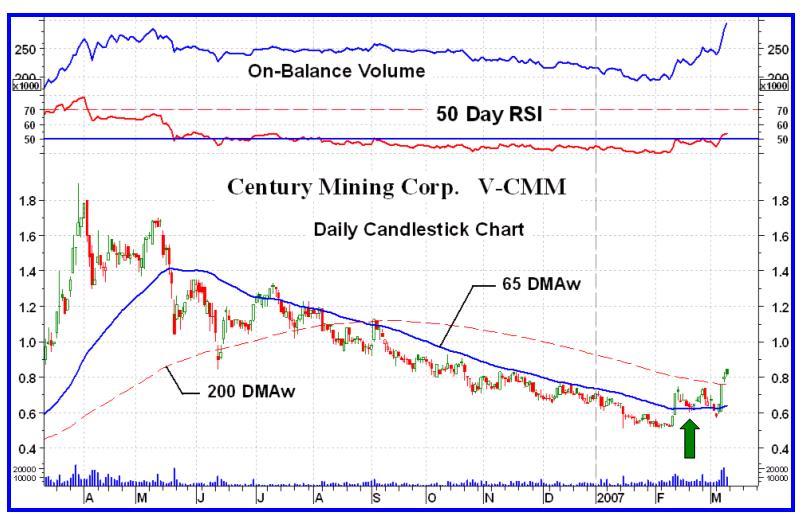
Looking at the chart of the Index we have the Index above both its moving average lines and both lines are sloping upward. Both momentum indicators are also in the positive zones although showing weakness in the Index action. There were 90 stocks (56%) advancing during the week and 66 stocks (41%) declining. There was only one stock in my arbitrary plus/minus over 30% weekly performance category showing that outright speculation is still quite subdued. The stock with the performance is Century Mining Corp (V-CMM). Century Mining went POS in my table of ratings a few weeks back. See chart on next page with the arrow indicating location of ratings reversal to POS (BULLISH). Readers might wish to check this stock with their investment advisor. It looks like more upside ahead, but a more detailed review is for subscribers.
The overall summation of individual ratings changed little this past week. The short term rating from a BEAR 66% last week to a BEAR 61% this week. On the intermediate term that shift was from a BEAR 54% to a NEUTRAL rating with neither bear nor bull. On the long term the ratings shift was slightly in the opposite direction from a BULL 56% to a bull 55%.
MERV'S QUAL-GOLD INDEX - MERV'S SPEC-GOLD INDEX - MERV'S GAMB-GOLD INDEX
All three sector Indices advanced on the week with the Gamb-Gold having the best performance of all Indices in the Precious Metals Indices Table with a 2.8% advance. Not much but hey, that's the best weekly performance. Looking at the charts of these sectors they all are mostly in sync. On the long term all three Indices are above their positively sloping moving average lines and all have positive momentum readings. Again, as with most precious metals Indices, the long term momentum of all three are showing weakness (but not yet confirming any kind of reversal). On the intermediate term there is some variation between the three. The Qual-Gold Index is the weakest with an Index below a negative moving average line and a momentum indicator that is sitting almost right on top of the neutral line, ready to go below. The Spec-Gold Index is a little better with the Index sitting right on top of its positive moving average line and a momentum that is slightly inside its positive zone. The Gamb-Gold Index remains the strongest with the Index well above its positive intermediate term moving average line and its momentum well inside the positive zone.
As for the ratings, the tables have it. Long term all are POS. For the intermediate term the Qual is NEG, the Spec is - NEUTRAL and the Gamb is POS.
SILVER
Silver went nowhere this past week. The bullion closed the week with a miserly 0.1% gain, about as low as it can go without going negative. The performance of the two Silver Indices was 10 times as good with gains of 1.0% and 1.4% for the Qual and Spec Indices. Saying 10 times the performance seems so much more impressive than just saying 1.0%.
I will forgo the chart this week as nothing important has occurred from last week. The price is still trapped inside its up trending channel, the volume indicator is still above its several month up trending trend line and momentum is still on top of its up trending trend line although it did go below for a couple of days during the week.
MERV'S QUAL-SILVER INDEX
With a 1.0% gain on the week one might say that the Index was just holding on for dear life. Despite the low overall Index gain there were 7 stocks that closed higher (70%) and 3 stocks that closed lower (30%) for a very good advance to decline ration on the week. As for the summation of individual ratings, they were a mixed bag. On the short term the rating went from a BEAR 75% to a BEAR 80%. For the intermediate term the move was in the opposite direction with the BEAR going from 65% to 50%. On the long term things were static at a BULL 60% rating.
As for the charts, the latest action was above the positive long term moving average line but below a negative intermediate term line. Momentum in both periods was still in the positive zone but for the intermediate term it was very, very close to the neutral line.
MERV'S SPEC-SILVER INDEX
Although the Spec-Silver Index has usually been one of the better performers this week it was no better than about average with a 1.4% gain on the week. That is still more than a 100% annualized gain if one were to project such one week value over the full year, but I digress.
As one might guess, with the 1.4% gain the number of advancing versus declining stocks were not far from a 50/50 split. In fact 56% advanced and 40% declined. As with the other Indices the summation of ratings moved very little and not consistently in the same direction. The short term rating slightly improved from a BEAR 64% to a BEAR 62%. On the intermediate term that move was from a BEAR 50% to a NEUTRAL rating, neither bull nor bear. On the long term the rating moved in the other direction from a BULL 60% to a BULL 56%.
As for the charts, everything is in the positive for both time periods, however, the Friday close was just a hair above the intermediate term moving average line and ready to possibly drop below again on the slightest negative.
Well. I'm calling it a day.
By Merv Burak,
CMTHudson Aero/Systems Inc.
Technical Information Group
for Merv's Precious Metals Central
Web: www.themarkettraders.com
e-mail: merv@themarkettraders.com
During the day Merv practices his engineering profession as a Consulting Aerospace Engineer. Once the sun goes down and night descends upon the earth Merv dons his other hat as a Chartered Market Technician ( CMT ) and tries to decipher what's going on in the securities markets. As an underground surveyor in the gold mines of Canada 's Northwest Territories in his youth, Merv has a soft spot for the gold industry and has developed several Gold Indices reflecting different aspects of the industry. As a basically lazy individual Merv's driving focus is to KEEP IT SIMPLE .
To find out more about Merv's various Gold Indices and component stocks, please visit www.themarkettraders.com and click on Merv's Precious Metals Central . There you will find samples of the Indices and their component stocks plus other publications of interest to gold investors. While at the themarkettraders.com web site please take the time to check out the new Energy Central site for the most comprehensive survey of energy stocks on the internet.Before you invest, Always check your market timing with a Qualified Professional Market Technician
© 2005-2022 http://www.MarketOracle.co.uk - The Market Oracle is a FREE Daily Financial Markets Analysis & Forecasting online publication.