


Looking at Trends in Non Farm Payrolls…Trade Smart, Trade Small
Stock-Markets / Stock Markets 2015 Apr 04, 2015 - 09:58 AM GMTBy: Dan_Norcini

I forgot exactly where and when I read it, but I recall seeing that one of the things that the Fed looks at when considering the employment situation, is a rolling 12 month average of the number of jobs created or lost. This gives them more of a smoothed indicator and tends to filter out the effects from what can often be notoriously volatile month to month readings. We traders tend to do this oftentimes with our various technical indicators in an attempt to filter out “noise”.
jobsI put together this chart for you using data supplied from the BLS website. Essentially what I did was to take each month’s payrolls number, subtract it from the previous month’s to get the number of jobs lost or created that month compared to the previous month. I then took a 12 month average of those monthly job increases or losses. Next I took a 12 month look back period to create a sort of rolling 12 month loss or creation average.
The following chart is what it produced.
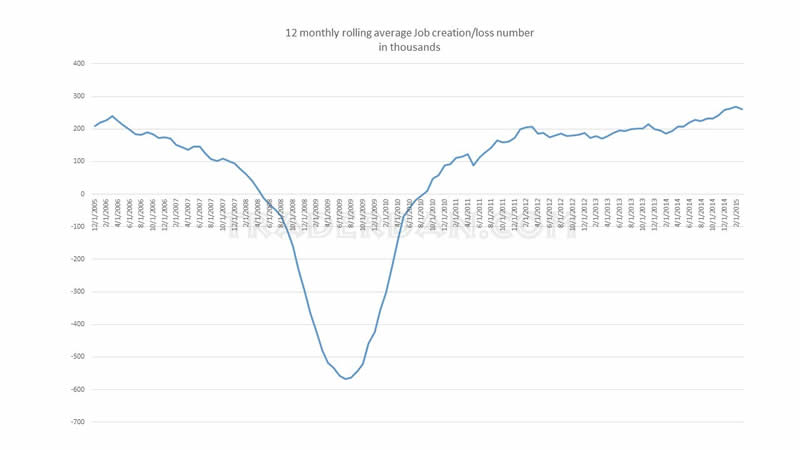
jobsIt is pretty helpful in determining some trends. Notice how the average monthly losses really escalated during the late 2008- 2009 time frame. It wasn’t until September 2010, that we finally saw the 12 month rolling average actually finally move into positive territory.
jobsSince that time, the general or overall trend has been higher but we have had our fits and starts. I am noticing that in late 2012/early 2013 and again in late 2013/early 2014 we did see a dip lower in the overall trend higher. The rolling 12 month average then began to turn higher once again as we moved further into the spring and summer months. Perhaps there is something to be said for the winter effect on overall job creation?
If that is the case, and I am not making any predictions here but rather just noting a pattern, subsequent payrolls reports should soon show some improvement IF the economy remains on track to slowly improve as this year progresses.
That means we now have two monthly payrolls reports before the Fed meeting in June at which some were thinking that they might hike. The April and May numbers will therefore give us some fresh perspective. As it now stand, the Fed funds futures markets has moved the first rate hike back to December of this year.
AS I said in a previous post, each piece of economic data is going to be scrutinized as we get it which each one having the ability to push interest rates and the currency markets one way or the other. The Fed has said that they are going to be data dependent when looking at when to move on the interest rate front. That is also true of we traders who are going to be increasingly at the mercy of the vagaries of each piece of economic data if we are trading certain markets which are so heavily dependent on that data.
Just be careful… this is not a time to be reckless. Trade smart- trade small until you see a trend in one direction or the other.
Dan Norcini
Dan Norcini is a professional off-the-floor commodities trader bringing more than 25 years experience in the markets to provide a trader's insight and commentary on the day's price action. His editorial contributions and supporting technical analysis charts cover a broad range of tradable entities including the precious metals and foreign exchange markets as well as the broader commodity world including the grain and livestock markets. He is a frequent contributor to both Reuters and Dow Jones as a market analyst for the livestock sector and can be on occasion be found as a source in the Wall Street Journal's commodities section. Trader Dan has also been a regular contributor in the past at Jim Sinclair's JS Mineset and King News World as well as may other Precious Metals oriented websites.
Copyright © 2015 Dan Norcini - All Rights Reserved
All ideas, opinions, and/or forecasts, expressed or implied herein, are for informational purposes only and should not be construed as a recommendation to invest, trade, and/or speculate in the markets. Any investments, trades, and/or speculations made in light of the ideas, opinions, and/or forecasts, expressed or implied herein, are committed at your own risk, financial or otherwise. The information on this site has been prepared without regard to any particular investor’s investment objectives, financial situation, and needs. Accordingly, investors should not act on any information on this site without obtaining specific advice from their financial advisor. Past performance is no guarantee of future results.
Dan Norcini Archive |
© 2005-2022 http://www.MarketOracle.co.uk - The Market Oracle is a FREE Daily Financial Markets Analysis & Forecasting online publication.