


Stock Market More Distribution Under Way?
Stock-Markets / Stock Markets 2015 May 11, 2015 - 08:48 AM GMTBy: Andre_Gratian

 Current Position of the Market
SPX: Long-term trend - The bull market is still intact.
Intermediate trend - Is the 7-yr cycle sketching an important top?
Analysis of the short-term trend is done on a daily basis with the help of hourly charts. They are important adjuncts to the analysis of daily and weekly charts which ultimately indicate the course of longer market trends.
MORE DISTRIBUTION UNDER WAY?
Market Overview
"The battle lines appear to have been drawn between the former high and the 2040 level. Breaking below 2072 should be the first sign that the proposed scenario is beginning to materialize."
Last week, we did break slightly below 2072, reaching 2068, but could not follow through and, instead, started a rally which appeared to culminate on Friday after a 50-point move. The action was strikingly similar to that of the week before when SPX had a fast decline which made a low on Thursday followed by a sharp rally on Friday. But this is where the similarity may end. The previous week's rally ended with a reversal last Monday, while by Friday, it looked as if we already had a short-term top in place.
That top, however, may not put an end to the rally from 2068. It may only be point "a" of an a-b-c pattern.
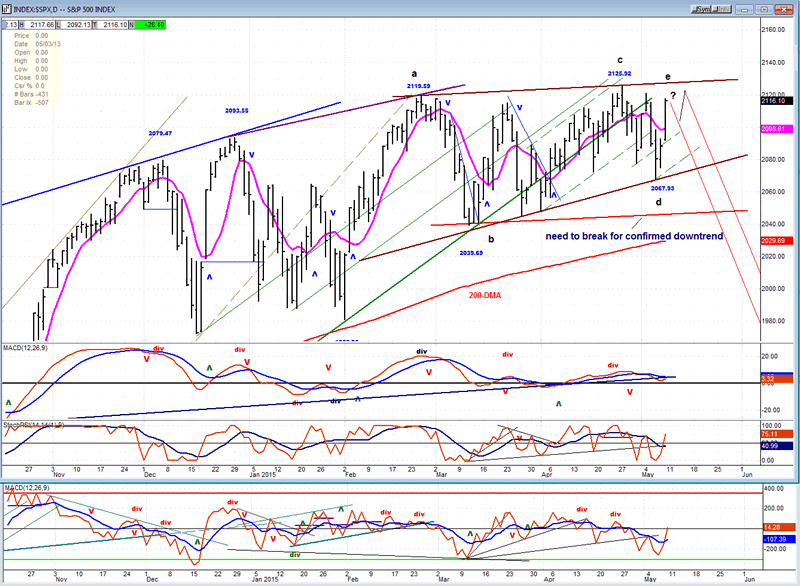
As Tony Caldaro pointed out in his "Weekend Update", it looks as if we are ending primary wave III in the form of a diagonal triangle which is nearing completion. That would fit very well into my rounding top theory, even if SPX makes a marginal new high, whether or not wave "e" is already complete. If not, completion could come this week.
Indicators Survey
As in the previous week, the weekly momentum indicators were rescued from extending their decline by Friday's sharp rally and are currently neutral with negative divergence. The daily MACD and SRSI are in the same relative position.
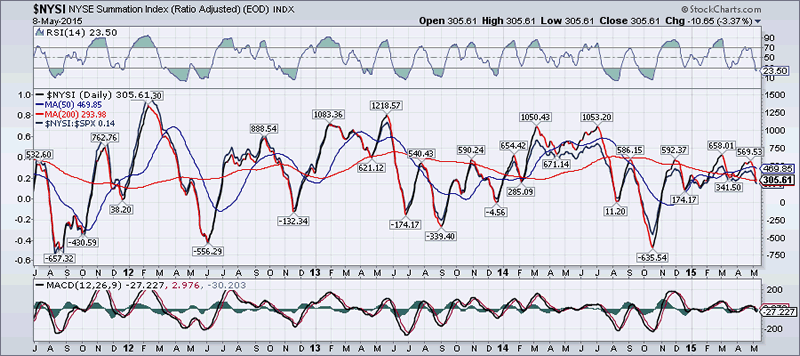
"The Summation Index (chart below courtesy of StockChart.com) turned down last week after diverging sharply from the March peak when SPX made a marginal new high. Both the RSI and MACD have also turned down after exhibiting the same kind of negative divergence. This is a bearish pattern which will worsen if the NYSI drops below its former short-term low of 341." -- which it did, although not by much. The recent pattern looks like a triple top or, if you want to stretch your imagination, you could see in it an H&S pattern. Either way, it has a bearish connotation.
Early on Friday SPX 1X P&F reached a target which was further validated by a Fib projection. The index then trended in a narrow range for the rest of the day.
The 3X price chart also has the look of a diagonal triangle which is nearing completion. If so, there is every reason to believe that this will be followed by the type of decline suggested in last week's letter.
Chart Analysis
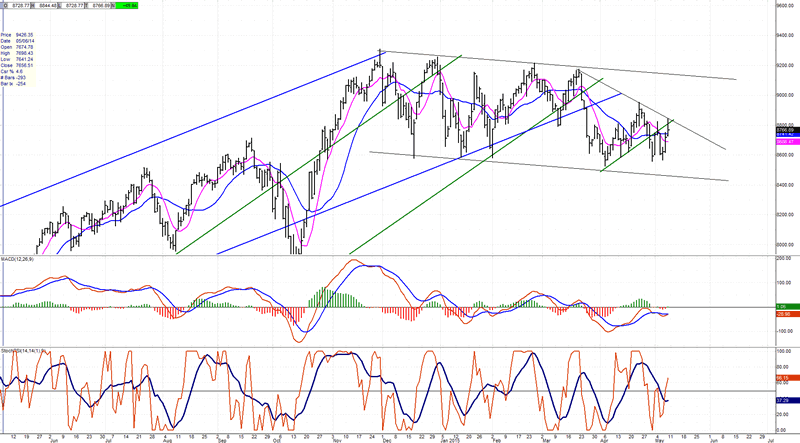
Let's start with our analysis of the daily chart of the SPX (courtesy of QCharts.com, as well as others below).
Since a diagonal triangle best explains the SPX behavior of the past three months, I have labeled it the way that Tony has it labeled. The only question is whether the "e" wave is already complete, or if Friday was only "a" of "e". We should find out next week. The Greek situation comes up again with an important meeting on Monday. If there is still no agreement, it could put some immediate pressure on the market and shorten wave "e", although a small pull-back followed by another move up would make more sense.
Friday's action looked very much as if a near-term reversal is ready to occur. With the short-term target already reached, odds favor a down opening on Monday, although positive news could make a difference. The A/Ds did act well and closed very positive. Also, the banking sector had a good day. On the other hand, IWM and QQQ, both important market barometers, were noticeable laggards.
Two consecutive days of strong closes also turned the daily oscillators and improved their con- ditions. It's now a question of follow through.
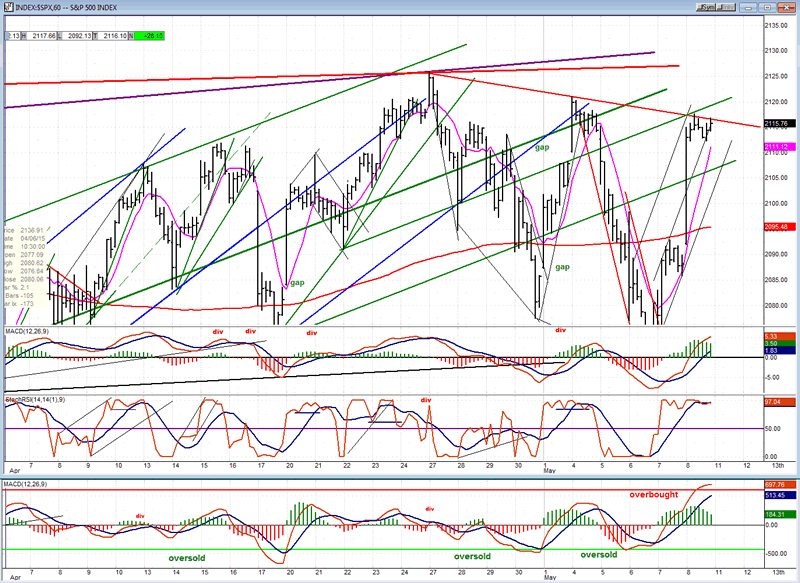
The hourly chart shows that besides having reached its target, SPX has also reached a downtrend line formed across the last two short-term tops, as well as the underneath of an internal parallel to the main trend line. Both of those combined have already provided enough resistance to stop the advance on Friday.
The hourly oscillators, which have reached overbought (especially the A/D at the bottom which is at a level from which it invariably turns) are already showing signs of turning. This is particularly evident in the MACD histograms which are declining. Of course, all the negatives discussed are only preliminary warnings, not confirmations. We will need to see some actual weakness appear -- enough to actually turn the price down and with enough follow-through to form a downtrend that can drive the oscillators to the other extreme of their ranges.
The leading indicators had a mixed reaction to last week's rally.
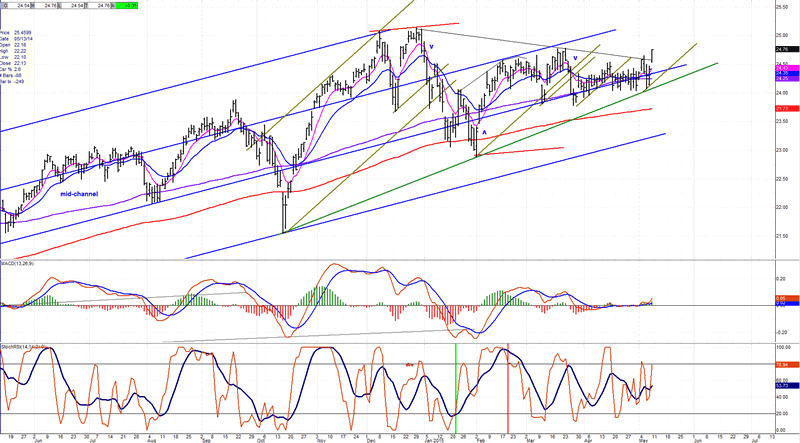
XLF
Had the strongest showing last week. It's now a question of whether it is the start of something or a flash in the pan. It has been holding on a mid-channel trend line for some time and also touched the green trend line last week. It was entitled to a bounce.
TRAN
Continues to be in a holding pattern at the bottom of a 5-month range. Any decisive break of the low would most likely indicate that an intermediate market correction has started.
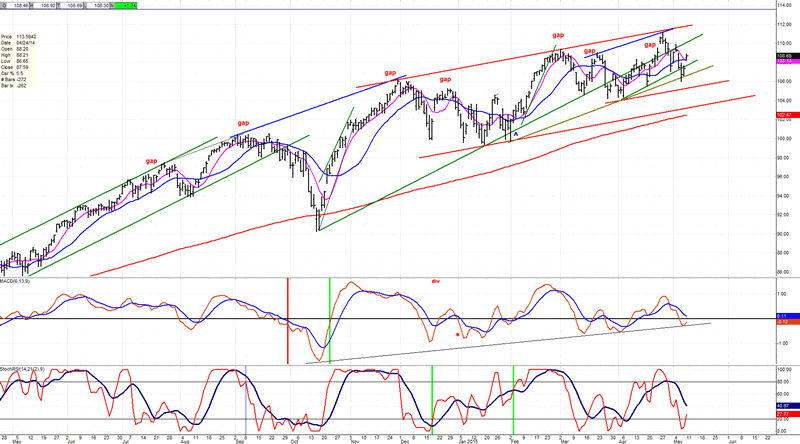
QQQ
Has been in a minor decline ever since it created a purported exhaustion gap. It is now trading below its green trend line and does not have much to show for last week's strong market bounce. But it still enjoys the support of several trend lines which will have to be challenged in order to accelerate its downtrend.
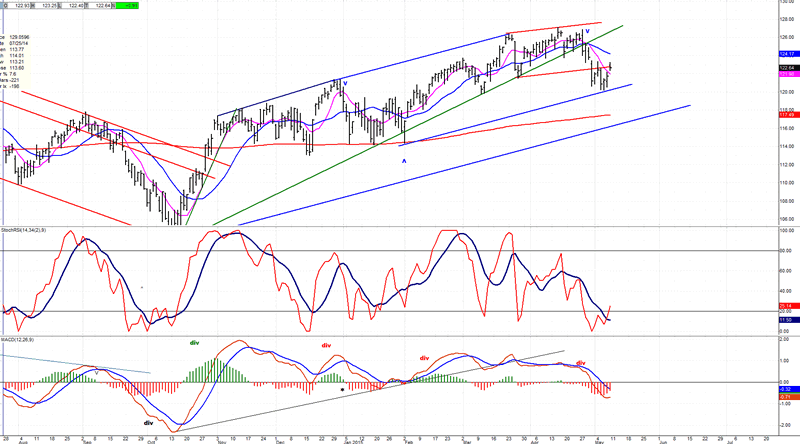
IWM
Is quickly becoming the weakest of the market leaders. The amount of distribution above the red line entitles it to a decline of some 10 to 12 additional points which would be roughly equivalent to reaching the bottom of the blue channel if it breaks below its mid-channel line.
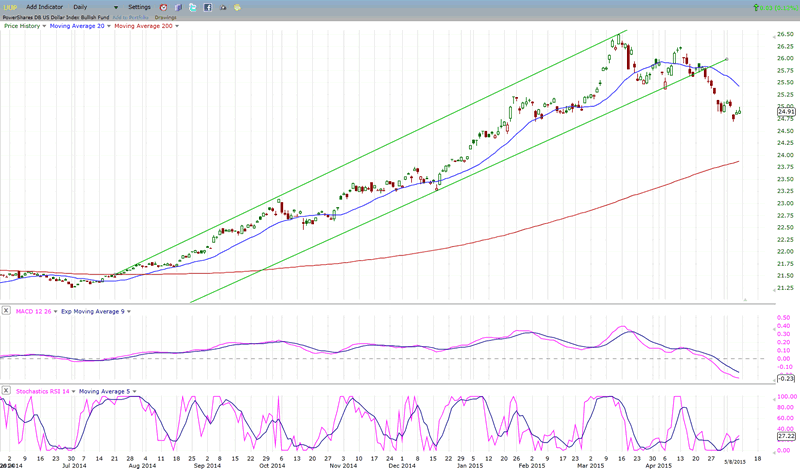
UUP
Should be close to completing its correction. If that assumption is correct and this is wave iv, a resumption of the uptrend should take it to the new highs that are suggested by the P&F count.
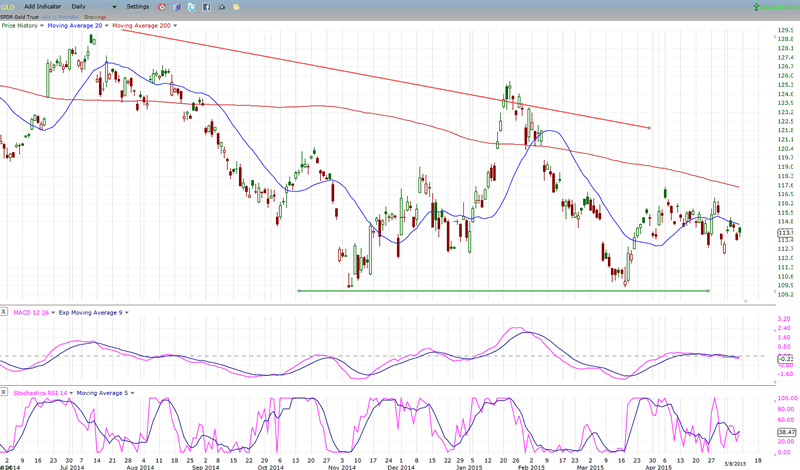
GLD
GLD should have entered the time frame in which its 25-wk cycle normally makes its low. Its inability to experience an immediate price lift justifies thinking that longer cycles are in play and that a reliable low point won't be seen until late June/early July.
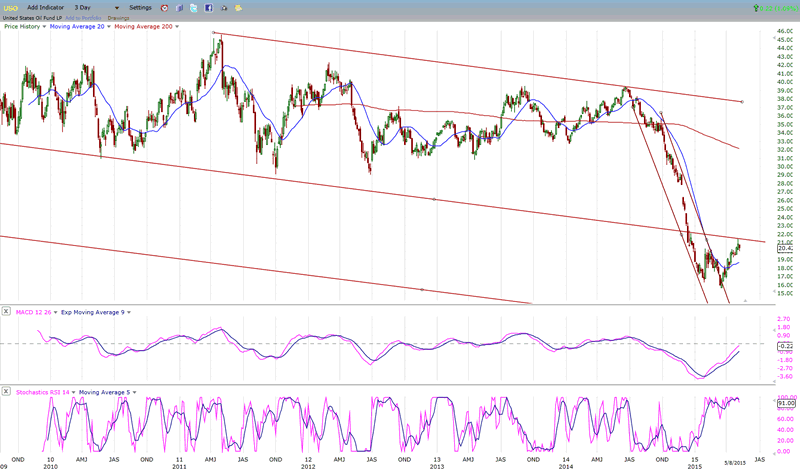
USO
USO has rallied to (and is finding resistance at) a mid-channel line. This would be a good level at which to end its oversold bounce and from which to resume its long-term downtrend.
Summary
One of the most interesting guesstimates about what the SPX is doing is that it is in the process of completing a diagonal triangle. If correct, next week should mark the pattern's completion followed by a substantial correction which could last several months.
FREE TRIAL SUBSCRIPTION
If precision in market timing for all time framesis something that you find important, you should
Consider taking a trial subscription to my service. It is free, and you will have four weeks to evaluate its worth. It embodies many years of research with the eventual goal of understanding as perfectly as possible how the market functions. I believe that I have achieved this goal.
For a FREE 4-week trial, Send an email to: info@marketurningpoints.com
For further subscription options, payment plans, and for important general information, I encourage
you to visit my website at www.marketurningpoints.com. It contains summaries of my background, my
investment and trading strategies, and my unique method of intra-day communication with
subscribers. I have also started an archive of former newsletters so that you can not only evaluate past performance, but also be aware of the increasing accuracy of forecasts.
Disclaimer - The above comments about the financial markets are based purely on what I consider to be sound technical analysis principles uncompromised by fundamental considerations. They represent my own opinion and are not meant to be construed as trading or investment advice, but are offered as an analytical point of view which might be of interest to those who follow stock market cycles and technical analysis.
Andre Gratian Archive |
© 2005-2022 http://www.MarketOracle.co.uk - The Market Oracle is a FREE Daily Financial Markets Analysis & Forecasting online publication.