


Stock Market On the Brink?
Stock-Markets / Stock Markets 2015 Jun 01, 2015 - 05:09 AM GMTBy: Andre_Gratian

 Current Position of the Market
SPX: Long-term trend - The bull market is still intact.
Intermediate trend - Are long-term cycles sketching an important top?
Analysis of the short-term trend is done on a daily basis with the help of hourly charts. They are important adjuncts to the analysis of daily and weekly charts which ultimately indicate the course of longer market trends.
ON THE BRINK?
Market Overview
A top is not yet confirmed but last week, we seemed to have come just a little closer to starting an important correction. The title best fits the daily chart of the Dow Jones Composite Index which appears next (courtesy of Qcharts.com as well as others below).
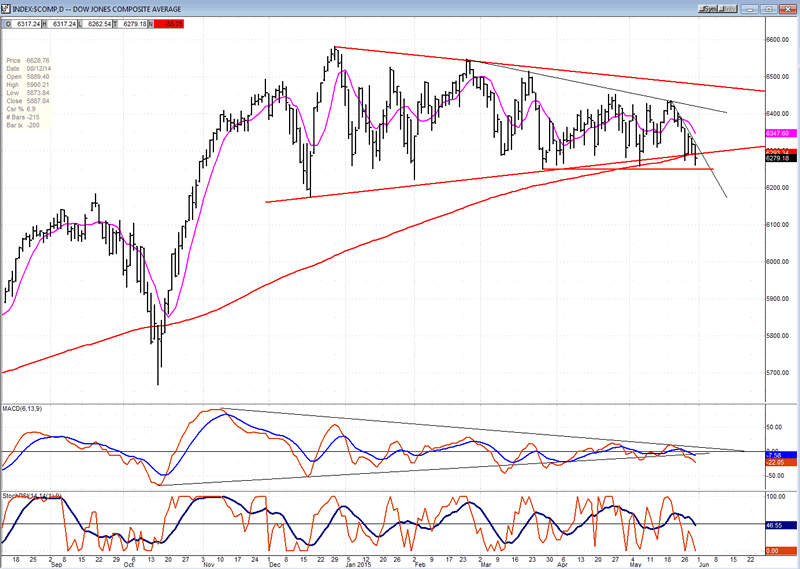
Since its late December high, it has created a pattern of descending tops and essentially flat bottoms which has resulted in a quasi-descending triangle formation which may be complete and can only be regarded as a bearish terminal pattern. On Friday, it closed just below the 200-DMA, but has not yet dropped below the last two short-term lows which held at about 6250 and were followed by a rally. A decisive close below that level would divulge its -- and the market's - intention!
Because it has come down to its current level in 5 waves, with price showing some deceleration in the past few days, it may not be quite ready to do so and could attempt another rally. But this would be only delaying what appears to be inevitable.
Indicators Survey
Last week's 20-point loss by the SPX was enough to turn down the weekly momentum indicators, also causing them to make a bearish cross.
The daily indicators also turned down, but the MACD still remains positive.
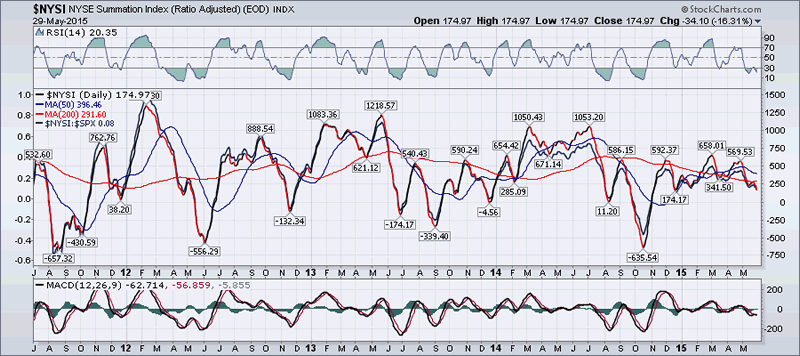
The Summation Index (chart courtesy of StockChart.com) dropped a little lower last week, nullifying its feeble attempt at starting an uptrend.
"Last week was a week of distribution in a narrow range for the SPX with a potential 50+- point correction if 2122 is broken." The decline which occurred did not reach the full potential of the pattern's count. The index rallied then moved sideways for most of the week appearing to add to the original distribution area -- more than doubling its count potential.
The pattern formed by the 3X chart carries a far greater count potential if everything that traded above 2040 turns out to be distribution.
Chart Analysis
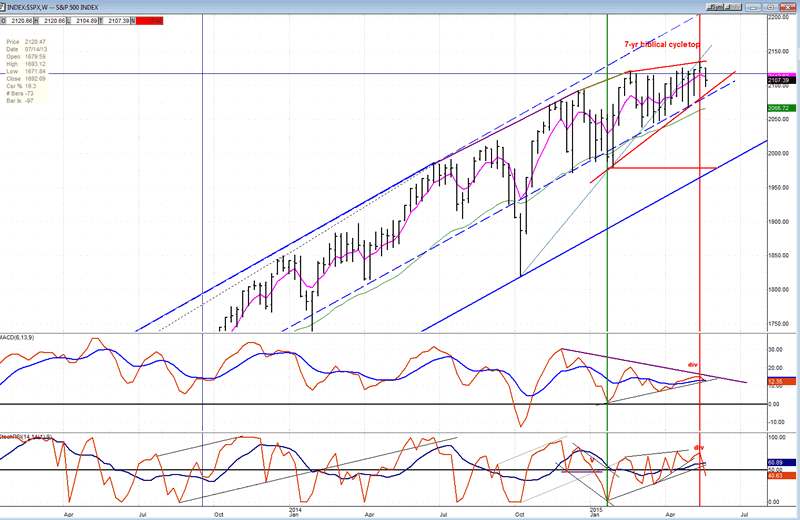
The Weekly chart condenses price movement enabling us to see more clearly the path that the index is taking over a long period of time. The blue channel represents the trend in which prices have traveled since October 2011. The two lines are parallels and have contained both highs and lows in the SPX during this time period. The bottom line has been touched exactly three times, the last being in October. The top line has been touched or closely approximated numerous times, and if this had continued, the 5/17 high would have conceivably been made at about 2200. Instead it turned out to be about 70 points short. In fact, over the previous 13 weeks, the index's momentum has rapidly decelerated, only increasing by about 15 points. That means that the bulls buying power is rapidly declining and, over that period of time, prices have been squeezed in a wedge pattern which appears to be an ending triangle.
What is also very noticeable is that except for a brief dip last October, prices have remained in the top half of the channel with the dashed line representing the mid-point. When an ending triangle is complete, prices have the habit of quickly retracing back to the point from which they oiginated. I have marked the beginning of the triangle with a green vertical line, and its conceivable end --which is suggested by the recent reversal of the oscillators -- with a red line. If this is confirmed by the market action, the prices should quickly retrace to the starting point (marked by a horizontal red line) which happens to coincide with the bottom of the blue channel. It also corresponds to the count that has been created by the last phase of distribution above 2068. Could market moves be that precise? Yes, as has been authenticated repeatedly by historical precedents, but only if it is confirmed that the index has completed the pattern in question and is starting an important correction. Until then, all that has been discussed is only conjecture.
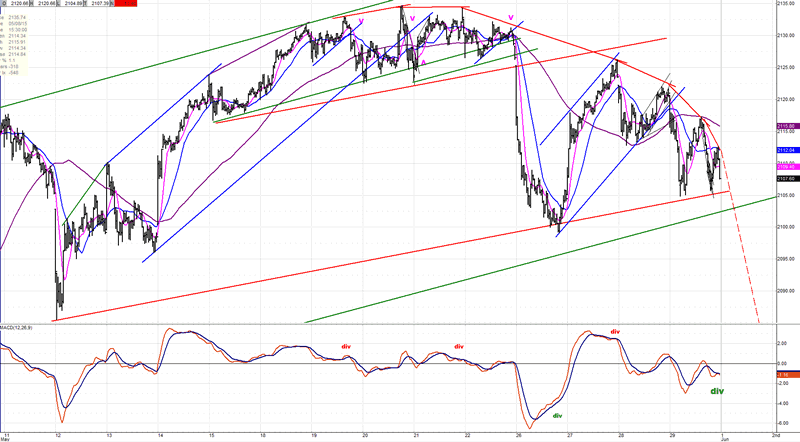
Since I had an elaborate analysis of the weekly chart, I am going to skip analyzing the daily, which would be somewhat repetitive, and again show the 10m chart. You can see how the small rounding top that I showed you last week was predictive of a decline which started right away on Monday. It stopped at the red support line and rallied, dropped back to it two more times, and held above it at Friday's close. It's obvious that it will have to go through it (and the green line) in order to start a decline.
If you look at the entire pattern, it looks like last week's rounding top was only the dome of a much larger one which formed last week. Another way to look at this is to see the two patterns as fractals. This is why punching through those support lines would have the same effect as it did above, except on a bigger scale.
One small caveat! If you look at the MACD below, you can see that it shows some positive divergence with the last price dip. That could mean that we are not quite ready to break below the lines and that some sort of rally will first occur to complete the pattern - or to change it completely! Tomorrow's opening should point to what will happen next!
Leading indicators
With a few exceptions, most leading indicators continue to be mixed. They are not showing any strength, but have refused to start a correction.
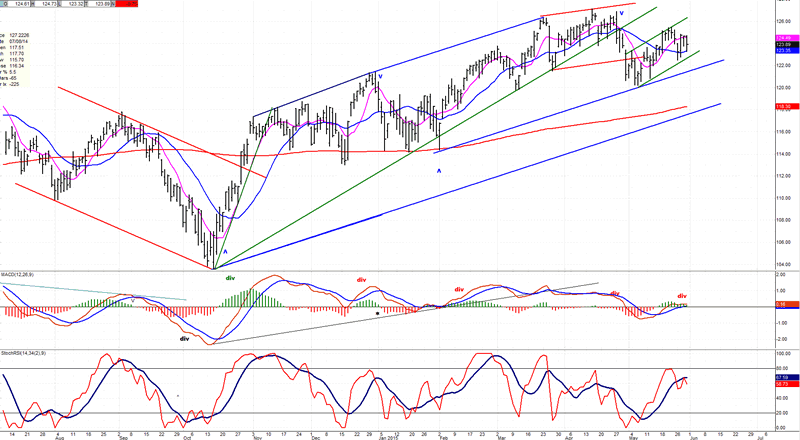
XBD (AMEX Securities Broker/Dealer)
Samo-samo! The index continues to trade in a bearish looking formation which normally resolves itself on the downside. This action has caused strong negative divergence in the MACD. Like the rest of the market, it seems to be only a question of time before a correction begins. On the P&F chart, it shows up as a significant pattern of distribution.
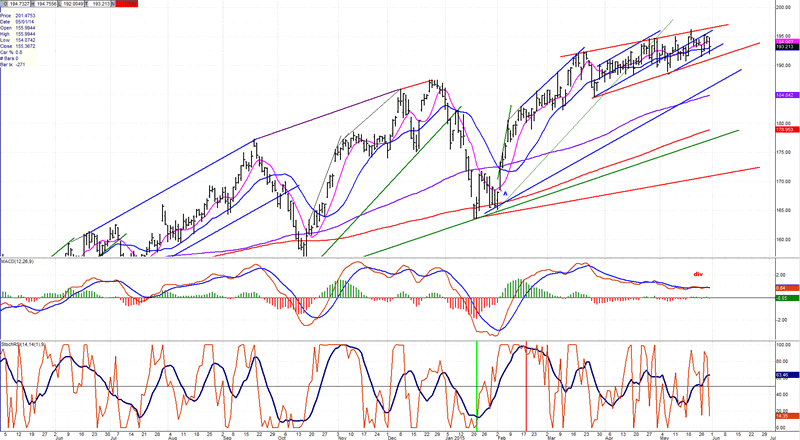
IWM (Rusell 2000 ETF)
Last week, IWM pulled away a little bit from its secondary top, but stopped short of resuming its downtrend. It would have to break below the shorter blue trend line to do so. The indicators seem poised for it to do precisely that!
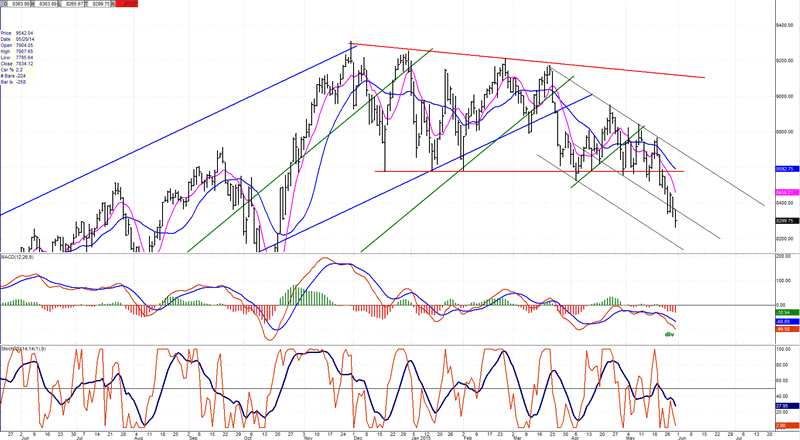
TRAN (Dow Jones Transportation Index)
The TRAN is the most negative of the principal indexes. This is having an effect on the DJ composite which is shown at the beginning of this article. If it keeps on declining, it should eventually gather a following among other market components.
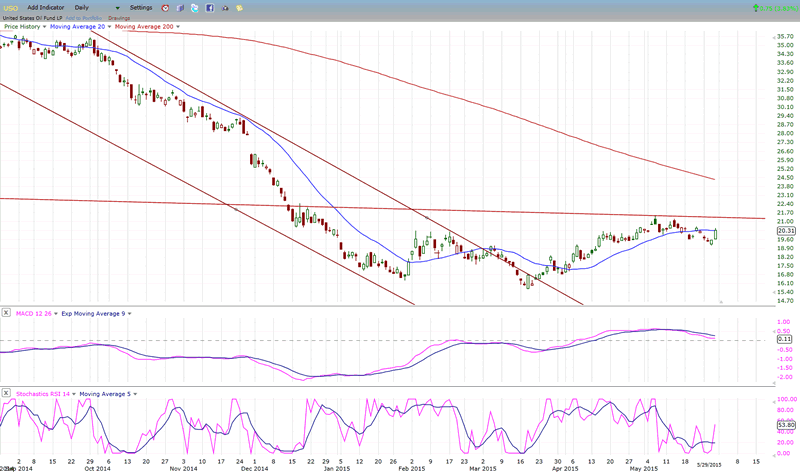
USO
During its oversold rally, USO rose slightly above the Feb top, and it is now using it as support. Until it trades below it, it could still make another attempt at breaking above its long-term mid-channel line.
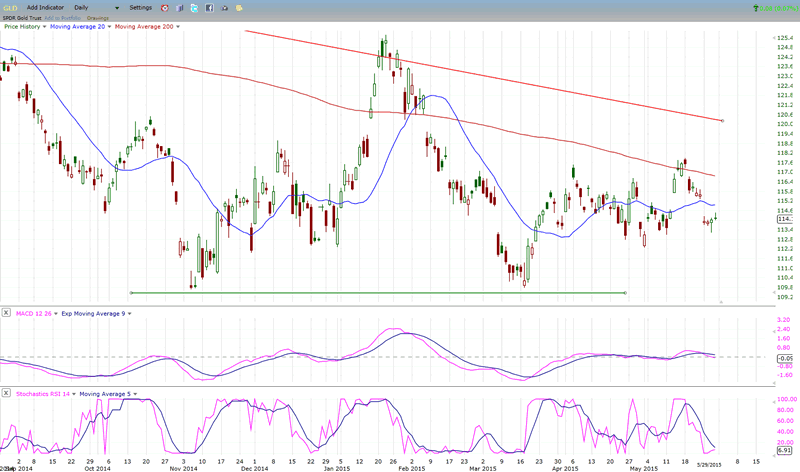
GLD
The rise in the dollar and other factors are keeping GLD from re-establishing an uptrend. If it does not sell below recent lows, GLD will have built an impressive base from which to start another rally in another month or so when longer term cyclical trends start shifting to the upside.
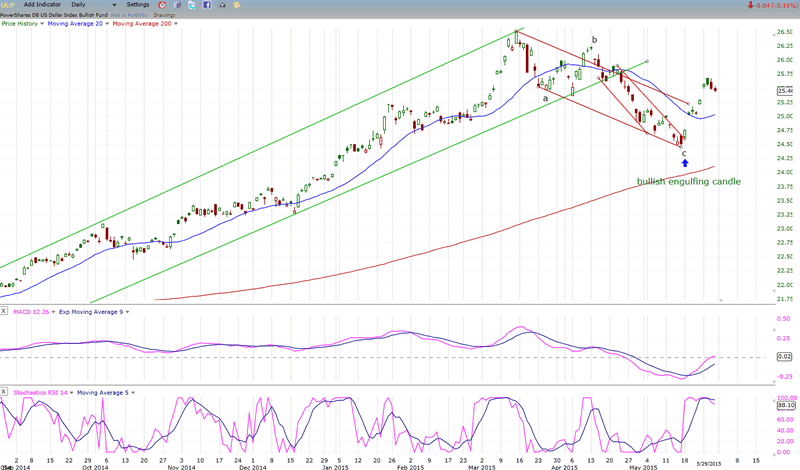
UUP
After correcting its initial uptrend for about nine weeks, UUP broke out of its corrective channel and is attempting to resume its upward path. The fact that this uptrend has emerged from a base whose count has not been exhausted yet should help it to eventually move beyond its former high.
Summary
In the previous article, I noted that the SPX could have made an important top at 2134.72. Last week's action has done nothing to disprove this view, but neither did it confirm it. Most indices appear to be waiting for a catalyst which will enable them to start a correction. Considering the market condition, this could come at any time but, until it does, more patience is required.
While the 7-year cycle is the principal force which is causing the market to build a top in this time frame, negative events are usually associated with large cyclical tops. One of these, reported as a news item, should become the trigger which will activate selling.
FREE TRIAL SUBSCRIPTION
If precision in market timing for all time framesis something that you find important, you should
Consider taking a trial subscription to my service. It is free, and you will have four weeks to evaluate its worth. It embodies many years of research with the eventual goal of understanding as perfectly as possible how the market functions. I believe that I have achieved this goal.
For a FREE 4-week trial, Send an email to: info@marketurningpoints.com
For further subscription options, payment plans, and for important general information, I encourage
you to visit my website at www.marketurningpoints.com. It contains summaries of my background, my
investment and trading strategies, and my unique method of intra-day communication with
subscribers. I have also started an archive of former newsletters so that you can not only evaluate past performance, but also be aware of the increasing accuracy of forecasts.
Disclaimer - The above comments about the financial markets are based purely on what I consider to be sound technical analysis principles uncompromised by fundamental considerations. They represent my own opinion and are not meant to be construed as trading or investment advice, but are offered as an analytical point of view which might be of interest to those who follow stock market cycles and technical analysis.
Andre Gratian Archive |
© 2005-2022 http://www.MarketOracle.co.uk - The Market Oracle is a FREE Daily Financial Markets Analysis & Forecasting online publication.