


Gold Price Analysis Update
Commodities / Gold and Silver 2015 Jun 07, 2015 - 05:02 PM GMTBy: Tony_Caldaro

 After Gold and Silver topped in 2011 many have been looking for a sustainable rally to trade, or exit long term positions. Yet the decline in the precious metals has been generally steady except for a few quick rallies here and there. We have also been looking for a Primary wave A low since last year as well. But each uptrend since then has been short lived or sold off substantially. Since the wave pattern on this four year decline has been quite complex we recently looked at Platinum to possibly get some clues about Gold.
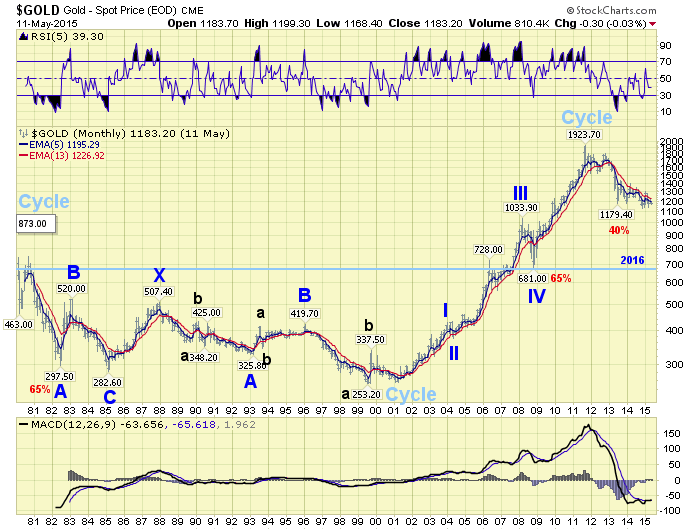
Historically, Platinum and Gold have generally moved together, with Platinum sometimes selling at a discount to Gold and most time selling at a premium. It is at a discount now.
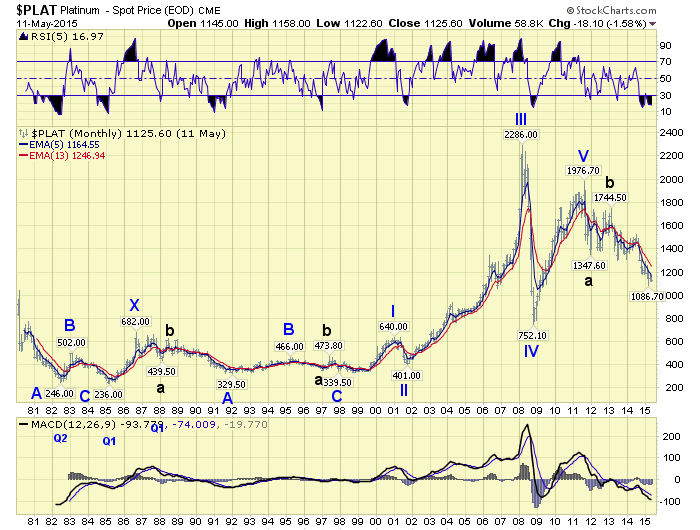
A review of the 1980-1998 bear market displays this relationship quite well. Notice all the bottoms of the Primary waves, in both Gold and Platinum, occurred in the same years, with the exception of the beginning of the bull market. During the bull market Platinum started early, in 1998, which led to a fifth wave failure in 2011. Gold started in 2001, and had a clear five waves up into 2011. From the 2011 high in Platinum it has had a Major a-b-c down, and is still declining. This suggests to us, Gold is not finished with its Primary wave A decline either. Therefore we would expect Gold to make lower low, or retest the low, before its Primary wave A ends. The low so far is $1,130.
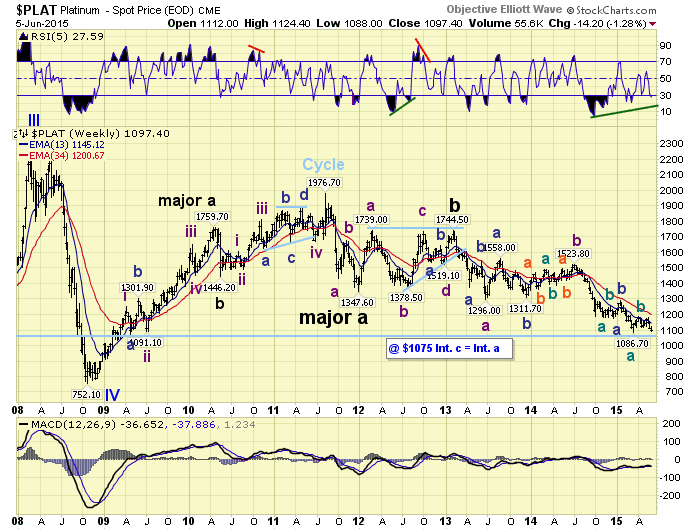
A review of the weekly Platinum chart suggests a potential support level at $1,075. This is where Int. C = Int. A, during Major wave C. When a similar count is applied to Gold there is potential support at $1125. This is where Int. C = 0.50 Int. A, during Major wave C. With both metals not that far from their potential lows, we should know fairly soon. You can follow the metals with us on pages 9 and 10 using the following link:
CHARTS: http://stockcharts.com/public/1269446/tenpp
After about 40 years of investing in the markets one learns that the markets are constantly changing, not only in price, but in what drives the markets. In the 1960s, the Nifty Fifty were the leaders of the stock market. In the 1970s, stock selection using Technical Analysis was important, as the market stayed with a trading range for the entire decade. In the 1980s, the market finally broke out of it doldrums, as the DOW broke through 1100 in 1982, and launched the greatest bull market on record.
Sharing is an important aspect of a life. Over 100 people have joined our group, from all walks of life, covering twenty three countries across the globe. It's been the most fun I have ever had in the market. Sharing uncommon knowledge, with investors. In hope of aiding them in finding their financial independence.
Copyright © 2015 Tony Caldaro - All Rights Reserved Disclaimer: The above is a matter of opinion provided for general information purposes only and is not intended as investment advice. Information and analysis above are derived from sources and utilising methods believed to be reliable, but we cannot accept responsibility for any losses you may incur as a result of this analysis. Individuals should consult with their personal financial advisors.
Tony Caldaro Archive |
© 2005-2022 http://www.MarketOracle.co.uk - The Market Oracle is a FREE Daily Financial Markets Analysis & Forecasting online publication.