
Solar Sun Spot Cycles Impact on Crop Yields, Energy Use and Weather Patterns
Commodities /
Energy Resources
Jun 18, 2008 - 08:00 PM GMT
By: Joseph_Dancy

 Last month we listened to Donald Coxe's weekly presentation to institutional investors. Coxe is the Chairman and Chief Strategist of Harris Investment Management. He has been a bull on the commodity markets for some time now and has correctly pointed out numerous investment opportunities in the energy, metals, and grain markets.
We were surprised when he mentioned the historical nature of the solar cycle and its' potential impact on global weather patterns and the agricultural sector. Most of the time Coxe he restricts himself to ‘worldly' indicators of supply and demand. Apparently an article on the subject recently appeared in Investor's Business Daily.
Since the performance of so much of our portfolio is driven by the weather – especially companies in the energy and agricultural sectors – and since Coxe notes the current sunspot cycle may point to lower global temperatures, we decided to examine the issue. Other long term forecasters we follow have not raised the issue to date.
 Sunspots have been monitored since around 1610, shortly after the invention of the telescope. They provide a long-running direct measurement of the sun's activity. The number of sunspots each year varies significantly, and over the centuries it appears sunspots have an 11-year cycle of activity from peak to trough.
Because accurate weather records extend back only a few centuries scientists must use ‘proxy' records to assess global climate conditions, including ice cores, tree rings, and even records of wine harvests.
Scientists can take ice cores from glaciers in Greenland or elsewhere and correlate sunspot activity with weather – at least weather in that part of the globe. Tree ring studies have also been used to correlate weather patterns with sunspot activity.
 Solar activity data appears to indicate that over the last century the number of sunspots rose in number and intensity. At the same time that the Earth's climate became steadily warmer. In theory, the more sunspots the more energy should reach the earth. Some experts argue that greenhouse gasses have enhanced the warming effect, others argue greenhouse gasses have had a minor impact. None-the-less solar activity and temperature appear to correlate.
One solar scientist recently published a paper on the issue of climate and sunspot activity, and found that the most striking feature is that looking at the past 1,150 years the sun has never been as active as it has been during the past 60 years.
Although the relationship between causation and correlation is an issue, global temperatures over the last 60 years have been very warm compared to historical norms.
The Maunder & Dalton Minimums
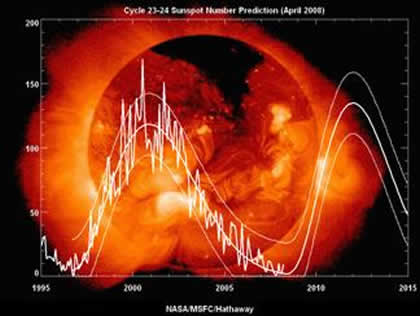
Coxe pointed out that we are at the low-point of the 11 year solar cycle (see chart above) – at the end of solar cycle 23 and at the start of solar cycle 24. Sunspot activity was expected to pick up significantly the last few months, with experts concerned about the impact of the powerful bursts of radiation on satellites, the electrical grid, and telecommunications systems.
But according to Coxe solar activity has been almost nil. He points out this has happened in the past. From 1645 to 1715 very little solar activity occurred after a normal series of cycles. Solar activity also declined from 1790 to 1830.
It is normal for the sun to have quiet periods between solar cycles, but some experts claim we've seen months of next to nothing activity-wise. While the start of solar cycle 24 seems to have materialized it “then abruptly disappeared.”
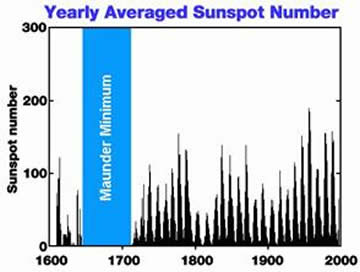
These historical periods of solar inactivity – dubbed the Maunder Minimum and Dalton Minimum after the astrologists who studied them - coincided with an irregular periods of rapid climate shifts. The climate cycles brought intensely cold winters, although periodically intense summer heat waves would also appear. The Maunder cycle is often referred to as the "Little Ice Age" – but climate experts claim the period is punctuated by both cold weather and rapid climate shifts.
These periods of low solar activity were also periods of sustained weather driven crop failures. Coxe notes that solar scientists strongly suspect there is a link between the Maunder and Dalton Minimums and the cold weather - but the exact mechanism remains elusive.
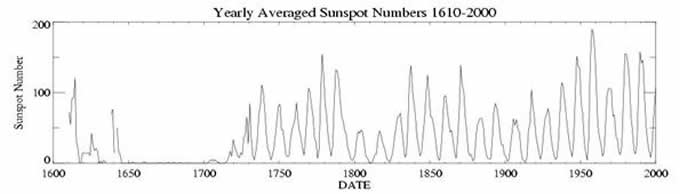
The ‘sunspot gap' from 1645 to 1715 – corresponding with the Little Ice Age – can be seen in the charts above.
The question Coxe raises, and one we cannot answer, is whether the lack of sunspot activity in this cycle portends a trend to cooler weather, shorter growing seasons, and increased space heating demands – or is it just a statistical fluke?
 Investment Implications
Coxe argues that if the lack of solar activity is not a statistical fluke natural gas would be a ‘pure play' on this event due to the huge amount of natural gas used for space heating in North America . Natural gas is a very efficient and non-polluting heating fuel.
We would tend to agree with his assessment, but note that the incremental use of natural gas as a summer electrical generation ‘peaker plant' fuel may decline if air conditioner loads are significantly reduced.
On the other hand the installed electrical generating capacity of natural gas fueled units continues to significantly expand, so the demands in the generation sector should increase regardless (see chart).
By Joseph Dancy,
Adjunct Professor: Oil & Gas Law, SMU School of Law
Advisor, LSGI Market Letter
http://www.lsgifund.com
Email: jdancy@REMOVEsmu.edu
Copyright © 2008 Joseph Dancy - All Rights Reserved
Joseph R. Dancy, is manager of the LSGI Technology Venture Fund LP, a private mutual fund for SEC accredited investors formed to focus on the most inefficient part of the equity market. The goal of the LSGI Fund is to utilize applied financial theory to substantially outperform all the major market indexes over time.
He is a Trustee on the Michigan Tech Foundation, and is on the Finance Committee which oversees the management of that institutions endowment funds. He is also employed as an Adjunct Professor of Law by Southern Methodist University School of Law in Dallas, Texas, teaching Oil & Gas Law, Oil & Gas Environmental Law, and Environmental Law, and coaches ice hockey in the Junior Dallas Stars organization.
He has a B.S. in Metallurgical Engineering from Michigan Technological University, a MBA from the University of Michigan, and a J.D. from Oklahoma City University School of Law. Oklahoma City University named him and his wife as Distinguished Alumni.
© 2005-2022 http://www.MarketOracle.co.uk - The Market Oracle is a FREE Daily Financial Markets Analysis & Forecasting online publication.
Comments
Rob Spooner
21 Jun 08, 10:45
|
Climate Realities
The global climate has not warmed steadily during the past century. During the quarter century after WW II, it dropped enough that people were concerned with "global cooling." The chart of sunspot activity shows a 20th century peak around 1950, when global cooling was active. If there has been global warming, which itself is open to debate, it was in the last two decades of the century, which don't have as much sunspot activity. That said, it does seem that when sunspot activity goes to nearly zero, there has been an impact. The sun has been very quiet and it's worth being concerned. It probably isn't worth founding an investment strategy on.
|
Robert Lipp
13 Jul 08, 14:08
|
Sun Spots Cycle - Low Activity
This article includes sun spot activity graphs up to 2000. Surely it does not take 8 years to release the latest activity counts. The key question - every month - is what is the current state of play? Has activity returned to normal - all breath a sigh of relief, or is activity still non-existent - be concerned very concerned? I really would like to find a data that is updated monthly for sun spot activity cycles - perhaps in graph format. Do you know of such a source - please sned me the address? Many thanks and appreciated.
|
Robert Balke
21 Jul 08, 16:08
|
Sun Spot Graphs
Try www.solarcycle24.com.
|
anonyma
09 Feb 09, 20:19
|
sunspot cycles
Interesting comments. The link between sunspots and commodities markets, is that high commodities prices with a lot of sunspots and low commodities prices with few sunspots? It would be interesting to see some accurate readable data to be able to see clearly if there is a connection between sunspot cycles and commodities prices.
|
John A. Jauregui
04 May 09, 21:42
|
CO2 is Good, Not Bad
CO2 is good, not bad. We all benefit from more of it in the atmosphere, especially farmers and foresters. Why? Plant growth stops at 200 PPM in the atmosphere. Plant growth is optimized at 1000 PPM; commercial greenhouse owners invest good money in CO2 generators to raise greenhouse concentrations toward the optimum to increase the productivity of their fixed growing area. In particular, increased levels of CO2 enable plant growth in drought conditions. 150 years ago CO2 concentration in the atmosphere was 285 PPM, now it's 385 PPM. It's like free airborne fertilizer in the atmosphere. Increased levels of CO2 have significantly increased crop and forest yields over the last century. If environmentalists truly wanted a greener planet they would want more, not less, CO2 in the atmosphere. Warmer temperatures are generally good, not bad. Most of us benefit from warmer temperatures, especially farmers and foresters. Why? Warmer temperatures increase growing seasons and produce more consistently successful crops from year to year. Warmer temperatures reduce heating fuel consumption in the winter. This is a very big deal today because world oil production peaked three years ago and will begin a permanent decline in two years. That is why the cost for all fuels is going through the roof. Fuel costs will only decline during economic down turns, like we are experiencing now. Warmer temperatures two thousand years ago enabled the rise of the Roman Empire. The subsequent cooling period resulted in the fall of the Roman Empire and the social and economic decline into the Dark Ages. The next warm period one thousand year ago ushered in the Renaissance. Today's warm period enabled the rise of the United States. The Dalton (type) Minimum the sun is now entering will dramatically affect us all by virtue if it's impact on crop yields in the northern and southern hemispheres. The cooling we are now experiencing, together with declining availability of carbon based fuels, will dramatically affect our lives and our economy. Taxing the use of carbon based fuels will make matters much worse. Taxing carbon is like leaning into a right hook. It's a quick way to end the fight. Warming is caused principally by the sun, not by elevated levels of CO2. Energy from the sun drives our climate, not CO2. Energy from the sun is modulated by the oceans and the atmosphere to produce our weather. Changes in climate are driven by long-term changes in the sun's radiative output and magnetic field strength. Google: Fairbridge Solar Inertial Motion (SIM) for a sense of how this works physically. The principal green house gas is water vapor. It provides 95 percent of our greenhouse warming effect. Without it the earth would be a ball of ice. As a greenhouse gas, CO2 is a distance fourth behind methane and nitrous oxide, which produce most of the remaining 5 percent of greenhouse warming. CO2's concentration in the atmosphere is four one-hundredths of one percent (.04 %). That's roughly equivalent to the thickness of the floor wax on your community's high school basket ball gymnasium, compared to the distance from the floor to the ceiling. The quantity and warming effect of CO2 in the atmosphere is negligible. The two trends described above have done more to "GREEN" the planet over the last several decades than anything humans have done to motivate that change. Both trends are now headed south, naturally. Solar activity is declining and will continue for the next few decades, cooling the earth about 2 degrees (C) in this quiescence period. The sun has just emerged from several decades of very high activity, which has warmed the earth by about one half degree(C). CO2 levels will naturally decline as carbon fuels production, particularly oil, begin their long decline. World oil production has been flat for three years. We are all going to meet our Kyoto targets whether we plan to or not. The environmentalists should be pleased. The rest of us won't.
|
John A. Jauregui
08 Jun 09, 22:42
|
Global Warming legislation
Global Warming legislation just came out of committee. World oil production is now in permanent decline. What oil is left will provide us the only bridge we will have to what comes next. I am asking myself, "Why is the Democratic Party making this a TOLL BRIDGE with the passage of this new tax legislation?" The move to change legislative language from "Global Warming" to "Climate Change" confirms Congress's acknowledgement that the planet is now cooling and that the decline in solar activity is responsible for the "Global Cooling" we are now feeling. Dubious? Google "IPCC Global Warming Potential (GWP)" to find the real story on CO2 as an atmospheric trace gas contributing to warming. Oh, by the way, what Prof. Mann's infamous hockey stick diagram Bristlecone proxy data shows conclusively is that nothing has done more to "GREEN" the planet over the past few decades than moderate sun-driven warming together with elevated levels of CO2, regardless of the source. Increase atmospheric CO2, increase crop and forest production. That's the bottom line. It’s no accident that commercial greenhouse operators invest heavily in CO2 generators to boost the productivity of their fixed growing facilities. Let’s review the arguments. Argument: Warming is bad. Fact: History shows warming is good. Rome rose to power during the Roman Warm Period. The Medieval Warm Period enabled the Renaissance. The Modern Warm Period gave rise to the US super power. Argument: CO2 causes warming. Fact: IPCC technical reports give CO2 a GWP of unity (1); lower than most trace gases by several orders of magnitude, particularly water vapor. Argument: People release CO2; therefore people are responsible for Global Warming. Fact: A review of the carbon cycle shows very clearly humans are responsible for only 3 percent of the CO2 entering our biosphere. How high would fuel Cap&Trade Taxes have to go for you to reduce your carbon fuels usage by 1/3? 2/3? Think about it. The result is in the noise, that is 1 or 2 percent reduction in CO2 production IF everyone on the planet complies. Simple Fact: World oil production has been on a plateau for 4 years. That production has now rolled off into permanent decline. Why put a crushing tax on it now? …and why avoid the subject leading up to the vote on this toxic legislation?
|

