


Gold Price Gravitating Lower Towards $1000
Commodities / Gold and Silver 2015 Jul 06, 2015 - 11:36 AM GMTBy: Clive_Maund

 Gold has not even been able to muster a rally on the Greek crisis, which is a bad sign, especially as the dollar looks like it is preparing to break out upside from a large consolidation pattern.
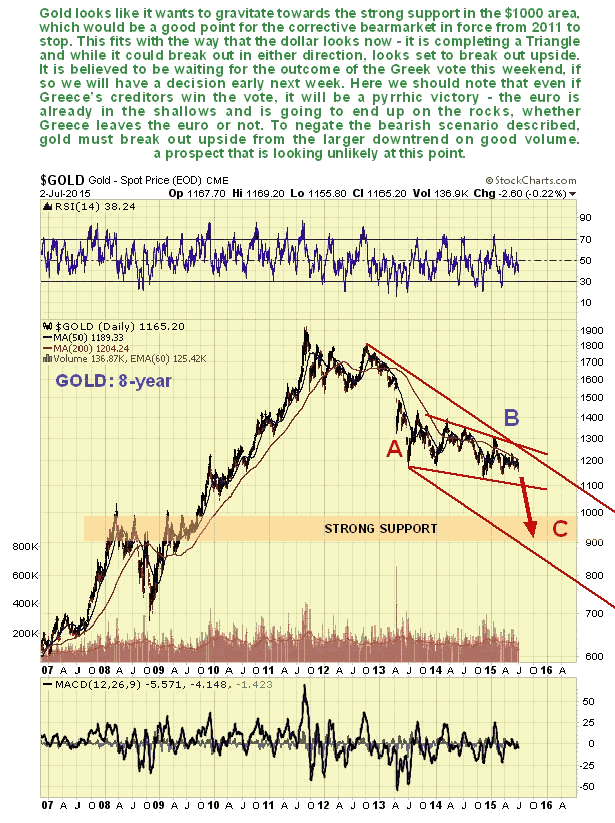
On its 8-year chart we can see that gold is still in the large downsloping consolidation pattern that has been going on for 2 years now. Goldbugs like to think that this trading range is a pattern is a base pattern, and while it may be, this is viewed as wishful thinking. Instead it looks like the B-wave of a large A-B-C correction from gold's highs in 2011. If it is, then the C-wave, which is suspected to be imminent, will take gold down at least to the strong support in the $1000 area, and probably lower towards the lower boundary of its large downtrend channel shown - if it gets there we are looking at $850 - $870. The good news is that this should mark the end of gold's bearmarket, especially as a rising rate cycle is just over the horizon, and contrary to popular belief, gold thrives in a rising rate environment - anyone remember the late 70's??
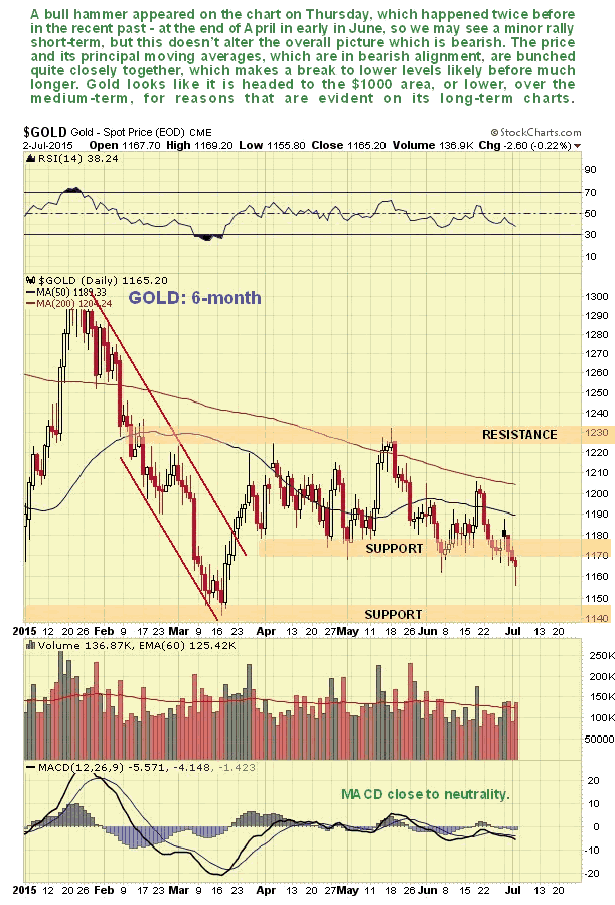
The 6-month chart, which is of limited use technically, shows us recent action in more detail. Action on this chart is generally bearish, although on the positive side, gold put in a bull hammer on Thursday, and the last two times it did that, at the end of April and early in June, a short-term rally followed. Overall though, this chart looks negative, especially as the price is quite closely bunched with its principal moving averages, which are in bearish alignment, suggesting that even if we see a minor short-term rally, a breakdown and quite steep decline is likely to follow.
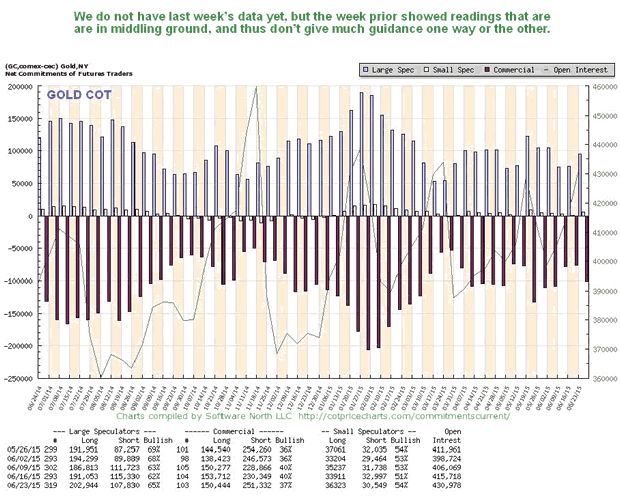
Gold's latest COT is in middling ground and thus provides limited guidance. Note that this chart lacks last week's update, probably because it has been delayed by Friday being a public holiday in the US. It will be updated after the latest data becomes available.
The Gold Hedger's chart is in middling ground and doesn't give us much of a clue about direction, one way or the other.
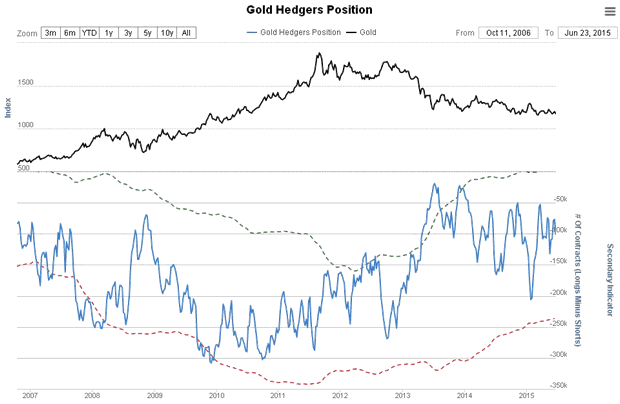
Chart courtesy of www.sentimentrader.com
The latest Gold Optix chart looks bullish. This won't stop gold from dropping as it can get even more bullish on a drop, but what this and the Rydex Precious Metals Assets chart, which follows, do tell us is that we are probably not too far from a major bottom here.
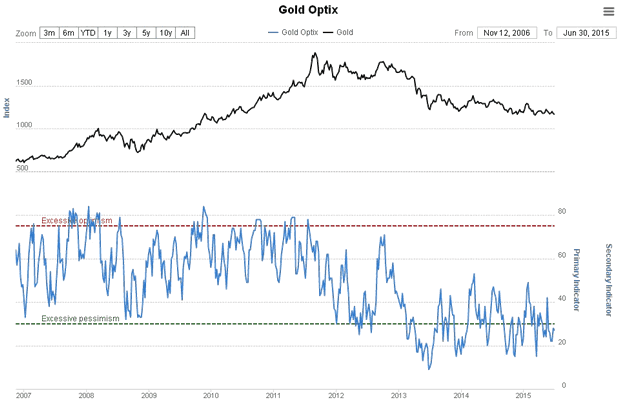
Chart courtesy of www.sentimentrader.com
The Rydex Precious Metals Assets chart certainly looks bullish and warns us not to get too bearish, even though we are expecting a drop over the medium-term, and also to keep a keep a close eye out either for convincing signs of a final bottom or evidence that a major new uptrend is starting, such as an upside breakout on strong volume from the major downtrend currently still in force.
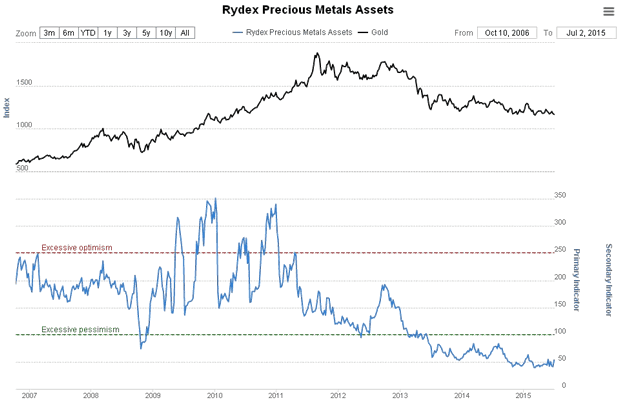
Chart courtesy of www.sentimentrader.com
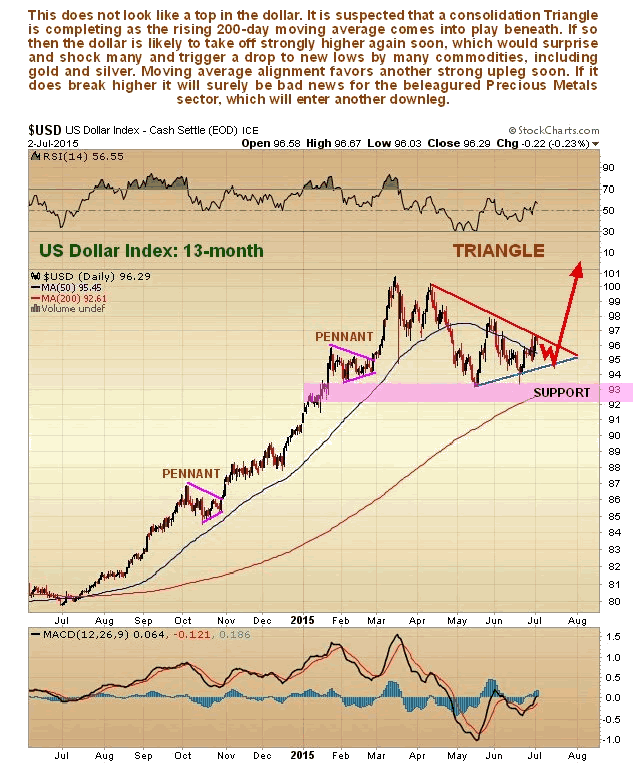
A big reason for expecting gold and silver to drop sharply to lower levels over the medium-term is the outlook for the dollar. The dollar is currently completing a Symmetrical Triangle pattern, which could be either a continuation pattern or a top. The point at which this Triangle has formed, some away above a still rising 200-day moving average, suggests that it is going to break out upside and embark on another major upleg, and it is not hard to see why, since the dollar index is comprised largely of the euro, and the euro is on the ropes, whichever way the Greek vote goes, after its countertrend relief rally of the past couple of months.
Conclusion: gold and silver look like they are consolidating within their downtrends ahead of another sharp drop, which is expected to synchronize with another dollar upleg. Over the longer-term, and contrary to general expectations, a mega bullmarket is expected to be ignited by a new cycle of rising rates, as in the late 70's, which will devastate the inflated bond and stockmarkets.
By Clive Maund
CliveMaund.com
For billing & subscription questions: subscriptions@clivemaund.com
© 2015 Clive Maund - The above represents the opinion and analysis of Mr. Maund, based on data available to him, at the time of writing. Mr. Maunds opinions are his own, and are not a recommendation or an offer to buy or sell securities. No responsibility can be accepted for losses that may result as a consequence of trading on the basis of this analysis.
Mr. Maund is an independent analyst who receives no compensation of any kind from any groups, individuals or corporations mentioned in his reports. As trading and investing in any financial markets may involve serious risk of loss, Mr. Maund recommends that you consult with a qualified investment advisor, one licensed by appropriate regulatory agencies in your legal jurisdiction and do your own due diligence and research when making any kind of a transaction with financial ramifications.
Clive Maund Archive |
© 2005-2022 http://www.MarketOracle.co.uk - The Market Oracle is a FREE Daily Financial Markets Analysis & Forecasting online publication.