


U.S. Official Unemployment 5.3%, Real 10.4%
Economics / Unemployment Aug 08, 2015 - 03:53 PM GMTBy: Mike_Shedlock

 Initial Reaction
Today's job report (for July) once again showed a divergence between the household survey and the establishment survey.
The divergence was not as large as last month, but was in the same usual direction: The establishment survey was stronger than the household survey.
Household survey employment rose by 101,000 while the establishment survey shows an increase of 215,000 jobs.
Last month the household survey showed a decline in employment of 56,000 while the establishment survey shows a gain of 233,000 jobs.
Part-Time Employment -760,000
One huge standout in the household data was a huge drop in part-time employment. Involuntary part-time employment declined by 180,000 while voluntary part-time employment shrank by 589,000.
The decline of 180,000 in involuntary part-time employment was enough to knock the U-6 unemployment rate down by 0.1% to 10.5%.
To show the volatility in this series, last month, voluntary part-time employment rose by 519,000 while part-time for economic reasons declined by 147,000.
Did 760,000 people really gain full-time employment from part-time status? No chance, but there's the number.
Note that last month's rise in voluntary part-time employment of 519,000 nearly matches this month's decline by 589,000.
BLS Jobs Statistics at a Glance
- Nonfarm Payroll: +215,000 - Establishment Survey
- Employment: +101,000 - Household Survey
- Unemployment: -33,000 - Household Survey
- Involuntary Part-Time Work: -180,000 - Household Survey
- Voluntary Part-Time Work: -589,000 - Household Survey
- Baseline Unemployment Rate: +0.0 to 5.3% - Household Survey
- U-6 unemployment: -0.1 to 10.4% - Household Survey
- Civilian Non-institutional Population: +213,000
- Civilian Labor Force: +69,000 - Household Survey
- Not in Labor Force: +144,000 - Household Survey
- Participation Rate: +0.0 to 62.6 - Household Survey
July 2015 Employment Report
Please consider the Bureau of Labor Statistics (BLS) Current Employment Report.
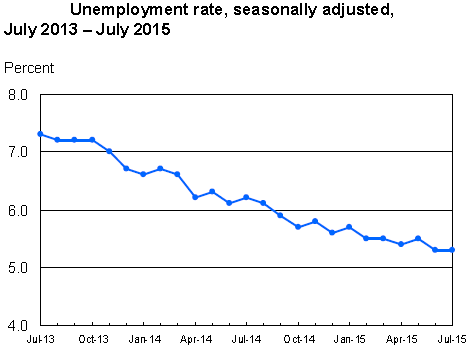
Total nonfarm payroll employment increased by 215,000 in July, and the unemployment rate was unchanged at 5.3 percent, the U.S. Bureau of Labor Statistics reported today. Job gains occurred in retail trade, health care, professional and technical services, and financial activities.
Unemployment Rate - Seasonally Adjusted
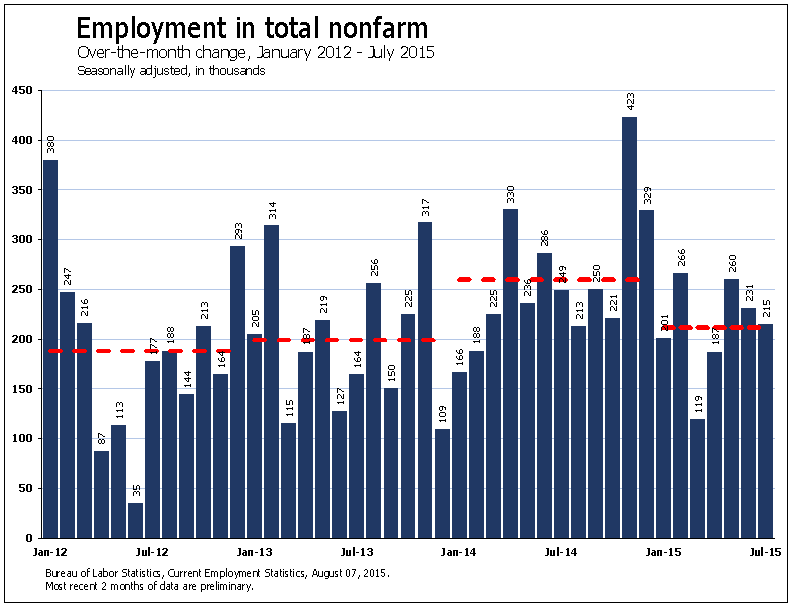
Nonfarm Employment
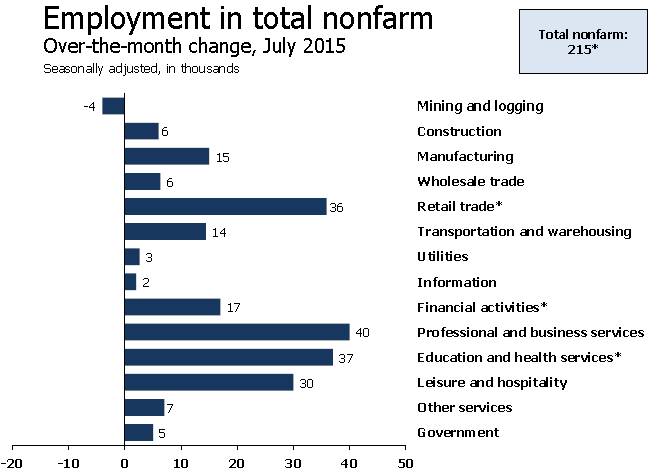
Nonfarm Employment Change from Previous Month by Job Type
Hours and Wages
Average weekly hours of all private employees rose by 0.1 hours to 34.6 hours. Average weekly hours of all private service-providing employees was flat at 33.4 hours.
Average hourly earnings of production and non-supervisory private workers rose $0.03 at $21.01. Average hourly earnings of production and non-supervisory private service-providing employees rose $0.05 at $20.82.
For discussion of income distribution, please see What's "Really" Behind Gross Inequalities In Income Distribution?
Birth Death Model
Starting January 2014, I dropped the Birth/Death Model charts from this report. For those who follow the numbers, I retain this caution: Do not subtract the reported Birth-Death number from the reported headline number. That approach is statistically invalid. Should anything interesting arise in the Birth/Death numbers, I will add the charts back.
Table 15 BLS Alternate Measures of Unemployment
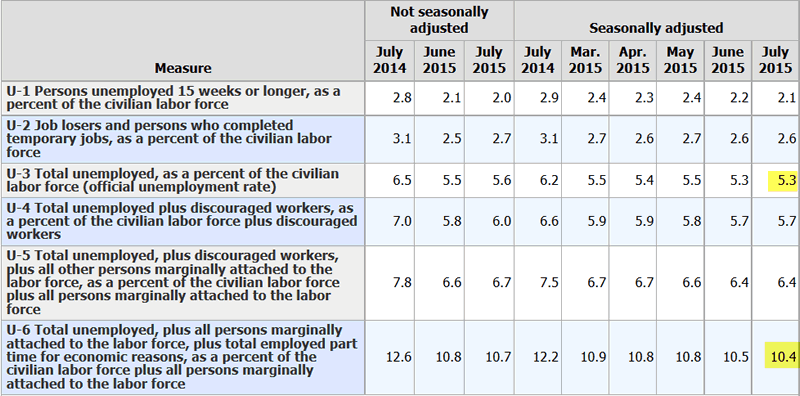
Table A-15 is where one can find a better approximation of what the unemployment rate really is.
Notice I said "better" approximation not to be confused with "good" approximation.
The official unemployment rate is 5.3%. However, if you start counting all the people who want a job but gave up, all the people with part-time jobs that want a full-time job, all the people who dropped off the unemployment rolls because their unemployment benefits ran out, etc., you get a closer picture of what the unemployment rate is. That number is in the last row labeled U-6.
U-6 is much higher at 10.4%. Both numbers would be way higher still, were it not for millions dropping out of the labor force over the past few years.
Some of those dropping out of the labor force retired because they wanted to retire. The rest is disability fraud, forced retirement, discouraged workers, and kids moving back home because they cannot find a job.
By Mike "Mish" Shedlock
http://globaleconomicanalysis.blogspot.com
Click Here To Scroll Thru My Recent Post List
Mike Shedlock / Mish is a registered investment advisor representative for SitkaPacific Capital Management . Sitka Pacific is an asset management firm whose goal is strong performance and low volatility, regardless of market direction.
Visit Sitka Pacific's Account Management Page to learn more about wealth management and capital preservation strategies of Sitka Pacific.
I do weekly podcasts every Thursday on HoweStreet and a brief 7 minute segment on Saturday on CKNW AM 980 in Vancouver.
When not writing about stocks or the economy I spends a great deal of time on photography and in the garden. I have over 80 magazine and book cover credits. Some of my Wisconsin and gardening images can be seen at MichaelShedlock.com .
© 2015 Mike Shedlock, All Rights Reserved.
Disclaimer: The above is a matter of opinion provided for general information purposes only and is not intended as investment advice. Information and analysis above are derived from sources and utilising methods believed to be reliable, but we cannot accept responsibility for any losses you may incur as a result of this analysis. Individuals should consult with their personal financial advisors.
Mike Shedlock Archive |
© 2005-2022 http://www.MarketOracle.co.uk - The Market Oracle is a FREE Daily Financial Markets Analysis & Forecasting online publication.