


Gold And Silver Market Bottoming? Big Rally Imminent? Reality Check Says NO
Commodities / Gold and Silver 2015 Aug 15, 2015 - 03:02 PM GMTBy: Michael_Noonan

 The developing events over the past few months are so varied, seemingly unrelated but are all tied in, just not in a cognitive manner that makes sense, and almost all them are based upon lies by one government after another, the worst offender being the US.
We find it hard to make a cohesive explanation as to their impact. This increasingly maze of events is mean to confuse, to deflect. It is a key element of the elites creating problems, reactions [usually confusion or panic by the masses], and offering solutions. Cyprus and Greece are similar examples. The Ukrainian coup by the US, sanctions against Russia that have so badly backfired. China an added part of the SDR, then maybe not. The list is much longer.
Because we cannot make a hand-to-eye conclusion as to how the unfolding event affect the ongoing suppression of the prices for gold and silver, most of the world's unfolding events are directly or indirectly tied into PMs as they relate to the increasing currency wars, now being stepped up by China.
When in doubt, we always revert back to that which cannot be denied: the reality of price.
Stories cannot be made up or twisted in an infinite number of self-serving ways to hide the truth. What cannot be hidden is price and what it reveals. For that story of greater certainty, we look to developing market activity and how it reflects the character of any given trend and where price fits in within the developing trend.
That cannot be hidden.
As an aside, we just posted an article by a man identified only as Hugo, entitled, Europe's Crises: a Dutch Perspective. It is the kind of information we like to present, but Hugo did it better. A good read, from our "Anything Goes" section.
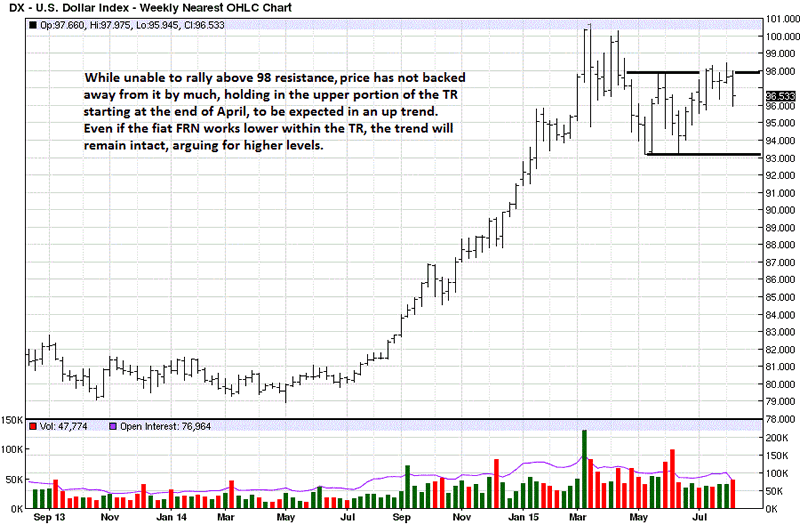
The charts for the fiat Federal Reserve Note, [FRN], are included because they are the antithesis of real money, gold and silver, and the fiats, in any form, are how the globalists maintain their debt enslavement over an unsuspecting, [certainly unbelieving] and willing public.
The resistance at the 98.50 area remains intact. The price rejection of two weeks ago could be a more temporary stopping point than a similar one from four weeks earlier. Four weeks ago, the reaction last only one week, and price closed near the high of the range. Last week the range down was much wider, and price closed nearer the low. This makes a weaker statement, especially since the rally high of two weeks ago was a probe higher than the one of four weeks ago, making nit more of a bull trap for those who thought they may be buying into higher highs that failed to develop.
US Dollar Index Weekly Chart
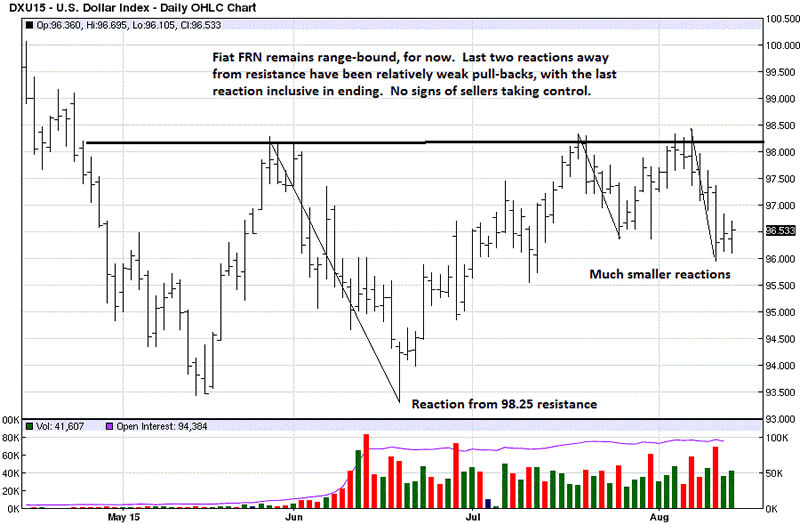
Last week's reaction can be seen more clearly on the daily. The lack of downside follow through after Wednesday's break under 96.50 recent support, 3 bars ago, shows two rally attempts with upper range closes, a plus statement for buyers. However, it is negated by the lack of further upside, making that two-day rally effort a relatively weak one.
Even if price continues lower, in the next several trading days, price would have to decline under the 93.50 area before one could say the bullish scenario has been altered. There is obvious potential support at 95.50 and again at 94.80.
US Dollar Index Daily Chart
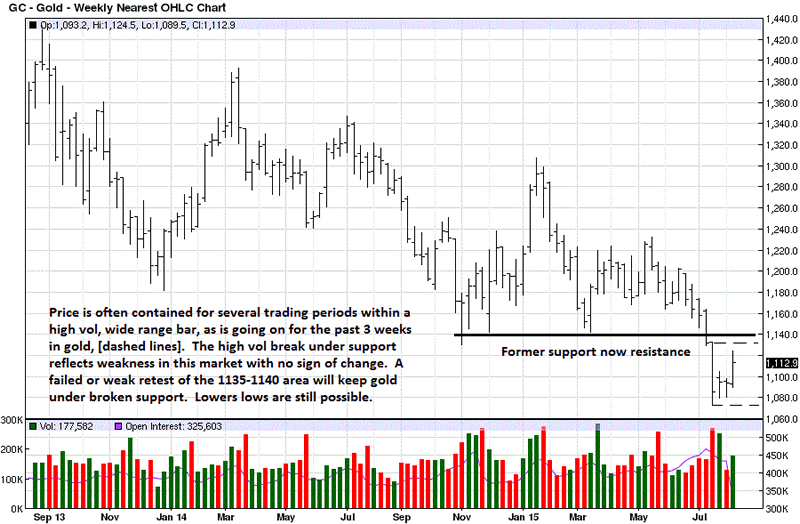
Everybody knows the incredibly bullish fundamentals for gold and silver. Not everybody is paying attention to developing market activity, which is diametrically opposed to the fundamentals. The break of support, four weeks ago, occurred on wide-spread and increased volume, and that speaks to weakness, not a market that is about to undergo a major rally.
The past three-week rally attempt was unable to retrace the single week decline, and that, too, speaks to overall weakness. It shows more clearly in the daily chart.
Gold Weekly Chart
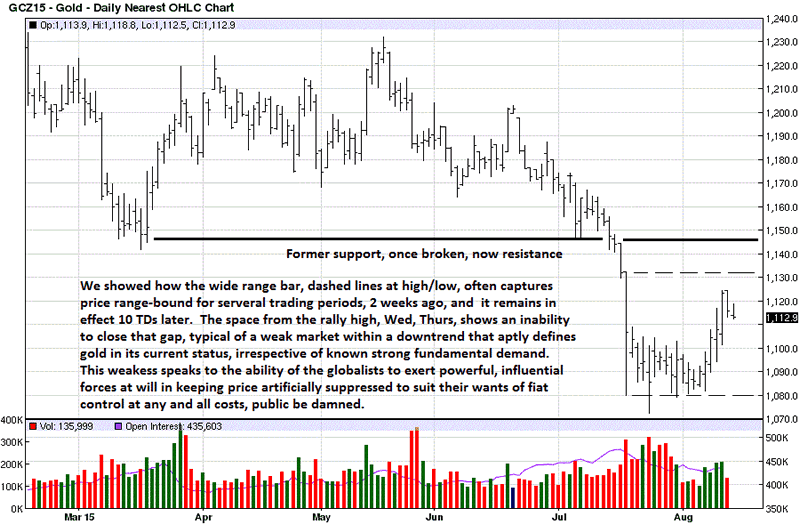
The wide range decline bar was addressed a few weeks ago when we said that type of bar tends to contain price activity for several periods going forward, and that was prior to the most recent 10 additional TDs.
Initial resistance is the high of the wide range bar down, at the 1132 area, and yet stronger resistance at broken support, the 1145 area. It does not matter how much gold China has bought, and continues to buy [you can include Russia and India, they make no difference], the globalists want the price of gold and silver suppressed as much as possible, and we include China as being a part of globalist ambitions, just in the early stages of participating with the elites.
China has no interest in wanting to see gold rally during its accumulation phase. Her time frame is not the same sense of urgency for that of Westerners who want everything done as soon as possible.
Gold and silver are real money. Any form of fiat is not. The elites are not about to give up their cash cow of creating infinite fiat in favor of controls that would be required using a gold standard of some kind.
Decide for yourself. Do you see anything ins developing market activity that suggests an imminent rally is at hand? Keep in mind, these charts do not show how price is at the lowest lows since the highs of 4 - 5 years ago.
Gold Daily Chart
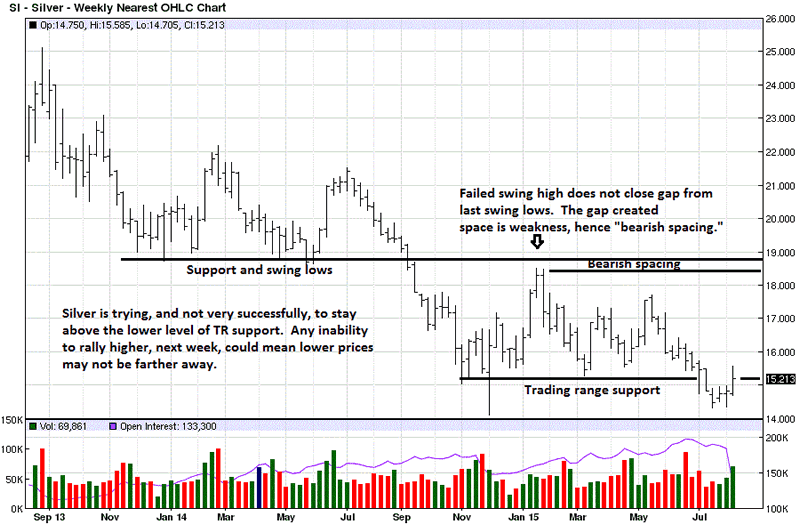
The story for silver is thought to be even more compelling than for gold, and the ratio between the two supports the prospects of silver outperforming gold to the upside, at whatever point the upside begins, after a low is confirmed. Yet, developing market activity is diametrically opposed to the fundamental prospects, evidenced in the charts.
The early January rally failed to close the gap from the earlier 2014 swing lows, and that gap is an indication of weakness. It shows sellers were willing to sell without waiting to see how the prior lows may be retested. The gap left is what is called "bearish spacing," and it becomes an area of resistance.
While price has held the TR lows, and not very impressively, until silver can mount a more accountable and sustained rally, the odds continue to favor yet lower recent lows. It does not matter how much gold China is hoarding. It does not matter how bullish is the story for silver. People can believe the stories being touted about how gold and silver are about to rally substantially higher. What these individuals are failing to recognize is the price is the final arbiter.
Silver Weekly Chart
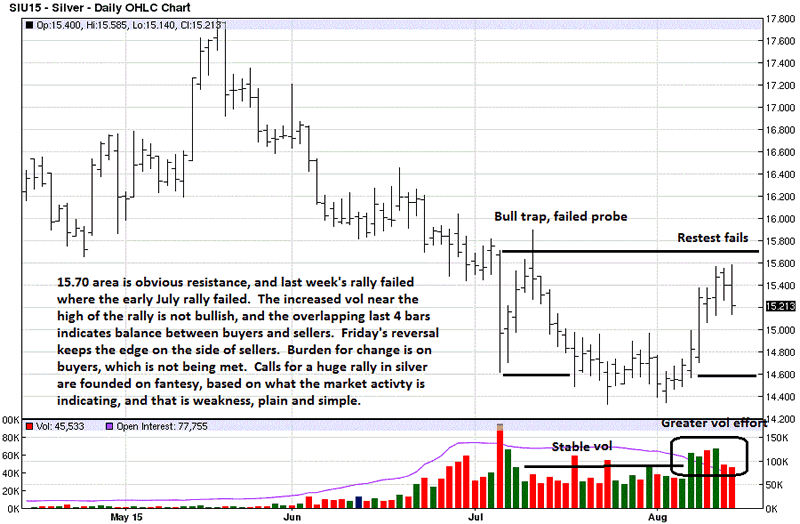
Early July is a bull trap because those who bought, anticipating higher prices were proven immediately long and wrong as price dropped quickly. It did stabilize at the lower end of the newly developed TR, and note how volume was relatively stable. Then, note how volume picked up on the rally that has so far failed again at the same area as in January.
What adds more question to the viability of this current silver rally is the increased volume. Typically, strong hands buy at lows, not on rallies after a recent low has been established. It could be a combined form of short-covering and also selling to weak handed buyers on the way up. Then note how the bars overlapped at the high of the rally. This indicates balance between buyers and sellers, and it culminated with a reversal day on Friday that just about erased the increased volume buy day on Wednesday.
Believe whatever hype you will about gold and silver primed for a major turnaround, and we are in the camp wanting to see higher prices, but we remain pragmatic in putting far greater belief into what the market is saying, via developing market activity, a much more reliable indicator of the character of the trend, and both trends for gold and silver are decidedly down.
By all means, buy whatever physical as you can, and hold it. As a not so inconsequential aside, the holding time frame may be longer than most think, which has already been true. As to buying any form of paper gold or silver, it is a fool's game for longs at current prices.
Silver Daily Chart
By Michael Noonan
Michael Noonan, mn@edgetraderplus.com, is a Chicago-based trader with over 30 years in the business. His sole approach to analysis is derived from developing market pattern behavior, found in the form of Price, Volume, and Time, and it is generated from the best source possible, the market itself.
© 2015 Copyright Michael Noonan - All Rights Reserved Disclaimer: The above is a matter of opinion provided for general information purposes only and is not intended as investment advice. Information and analysis above are derived from sources and utilising methods believed to be reliable, but we cannot accept responsibility for any losses you may incur as a result of this analysis. Individuals should consult with their personal financial advisors.
Michael Noonan Archive |
© 2005-2022 http://www.MarketOracle.co.uk - The Market Oracle is a FREE Daily Financial Markets Analysis & Forecasting online publication.