


USDJPY At Critical Juncture
Currencies / Japanese Yen Aug 17, 2015 - 06:46 PM GMTBy: Austin_Galt

Previously, I thought the high for the USDJPY was in place and a correction was now underway. It still may be. Price is now at a critical juncture and the potential exists for one last marginal false break high. Let's examine the situation using the weekly chart.
USDJPY Weekly Chart
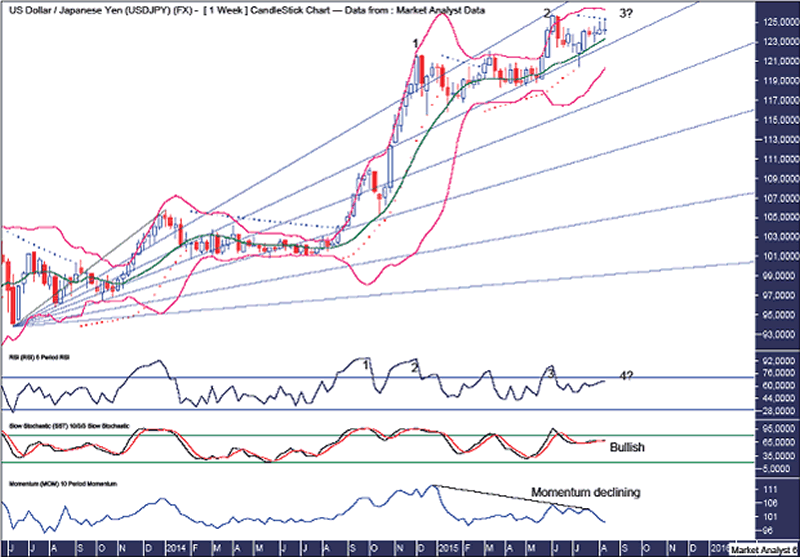
We can see there are currently two consecutive highs in place and there exists the possibility of a "three strikes and you're out" top to form. This is denoted by the numbers 1 to 3.
I have drawn a Fibonacci Fan which shows the second strike high was at resistance from the 23.6% angle. This occurred exactly as forecast and I believed that to be the final high. However, price has subsequently found solid support at the next 38.6% angle and a new high now looks to have real potential before price comes back down to break clearly below this 38.2% angle.
The Bollinger Bands show price finding support at the middle band and one last hurrah move back to the upper band looks to be on the cards.
The PSAR indicator shows price currently finding resistance from the dots which are just above price and will be around 125.30 this coming week. This is the critical juncture. Price busting above this level will most probably see price crack to new highs above 125.85.
The RSI show a triple bearish divergence already in place while one last marginal high would most likely set up a quadruple bearish divergence.
The Stochastic indicator is currently bullish although one solid week down would alter that.
The Momentum indicator show momentum declining since the first strike high so whichever way you look at it a correction is indeed imminent.
Summing up, price is now at a critical juncture with the potential for one last marginal high before a serious correction occurs. While I previously favoured the final high to be in place I now have doubts about that and would prefer to see one last high. Either way, this week should tell the tale.
By Austin Galt
Austin Galt is The Voodoo Analyst. I have studied charts for over 20 years and am currently a private trader. Several years ago I worked as a licensed advisor with a well known Australian stock broker. While there was an abundance of fundamental analysts, there seemed to be a dearth of technical analysts. My aim here is to provide my view of technical analysis that is both intriguing and misunderstood by many. I like to refer to it as the black magic of stock market analysis.
Email - info@thevoodooanalyst.com
© 2015 Copyright The Voodoo Analyst - All Rights Reserved
Disclaimer: The above is a matter of opinion provided for general information purposes only and is not intended as investment advice. Information and analysis above are derived from sources and utilising methods believed to be reliable, but we cannot accept responsibility for any losses you may incur as a result of this analysis. Individuals should consult with their personal financial advisors.
Austin Galt Archive |
© 2005-2022 http://www.MarketOracle.co.uk - The Market Oracle is a FREE Daily Financial Markets Analysis & Forecasting online publication.