


Silver – More Evidence of a Price Bottom
Commodities / Gold and Silver 2015 Aug 20, 2015 - 02:22 PM GMTBy: DeviantInvestor

 Silver prices hit a low of about $14.33 on July 24 after High Frequency Traders had run stops that week. It has happened before and will again. Occasionally they will run stops going up, not down. The gold to silver ratio has been hovering around 75.
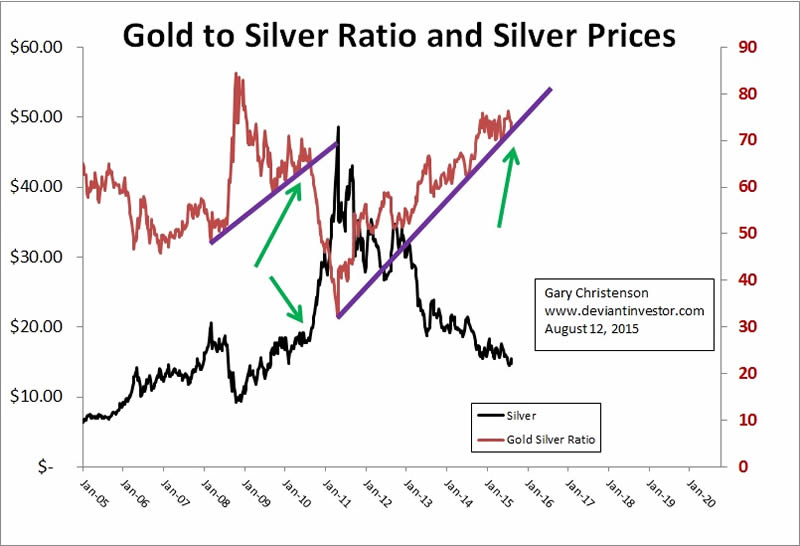
That ratio has a long history of volatility. The ratio is high when silver prices are low and as silver prices push higher, the ratio drops. Note the graph of the gold to silver ratio using weekly data for ten years.
The red line shows the ratio, currently second highest in 12 years. The purple lines show trend line support for the ratio, which when broken, indicate a new move upward in silver prices. The black line shows silver prices.
Perhaps more useful is the same data but plotted as the silver to gold ratio. The ratio and the price of silver correlate well. Purple lines indicate trend line resistance. The dashed green arrow is my estimate of future price direction for silver.
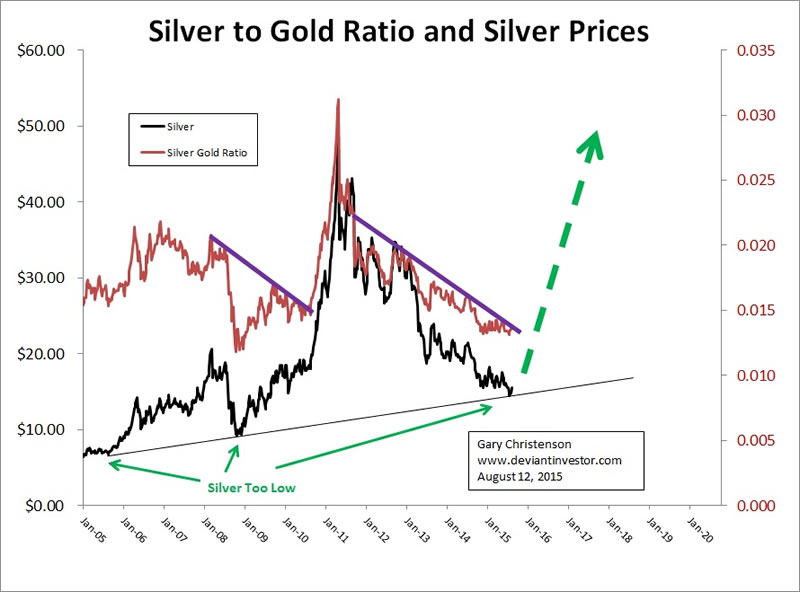
- The silver to gold ratio and silver prices are near multi-year LOWS.
- The trend line resistance for the ratio, as I have drawn it, is about to be broken, indicating a new upward silver price trend.
- Silver prices have been crushed for over four years, are deeply oversold, and ready to rally.
- The stock market has moved up tremendously since 2009 and has attracted the majority of media and financial world attention. Silver has been largely forgotten, which is an excellent place to begin a multi-year rally.
Note the following graph of weekly silver prices on a log scale.
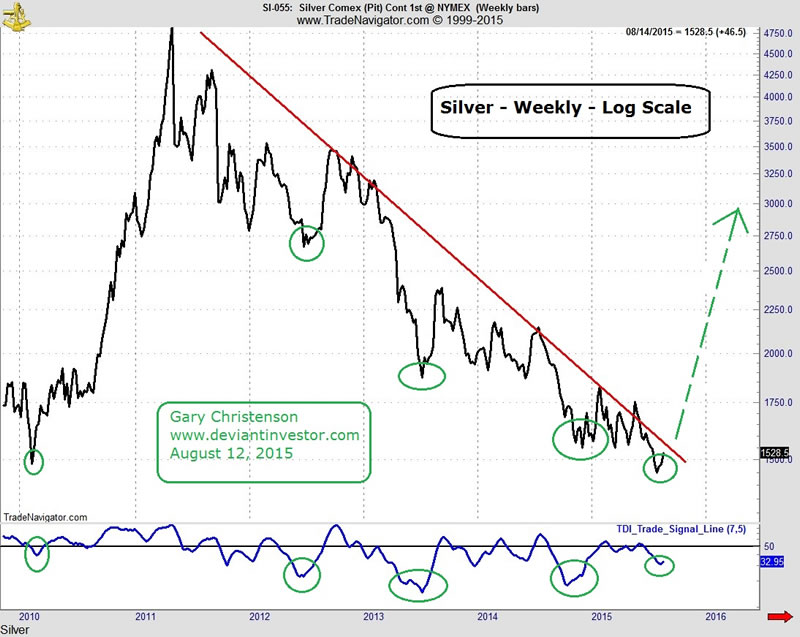
- The red line shows a four year trend line – sloping downward – that is about to be broken.
- The weekly TDI indicator at the bottom of the chart has turned upward from an oversold condition.
- Expect a rally in silver prices.
There are many other conditions that point to higher silver prices in the next several years, but the most important are:
- Continued exponential increase in sovereign debt – all essentially unpayable. There will be blood.
- Continued exponential increase in other debt: auto loans, student loans, junk bonds, corporate debt, mortgages, credit card debt and more. Some of this will default. It will become ugly for many.
- Massive “money printing” by global central banks. It is one of their best moves.
Debt will be paid or liquidated. It can be paid with newly “printed” money, or it can be defaulted. I fully expect central banks to paper over defaults with more “printed” money. Either way, expect more QE, devalued fiat currencies, and higher prices for real money – silver and gold.
GE Christenson aka Deviant Investor If you would like to be updated on new blog posts, please subscribe to my RSS Feed or e-mail
© 2015 Copyright Deviant Investor - All Rights Reserved Disclaimer: The above is a matter of opinion provided for general information purposes only and is not intended as investment advice. Information and analysis above are derived from sources and utilising methods believed to be reliable, but we cannot accept responsibility for any losses you may incur as a result of this analysis. Individuals should consult with their personal financial advisors.
Deviant Investor Archive |
© 2005-2022 http://www.MarketOracle.co.uk - The Market Oracle is a FREE Daily Financial Markets Analysis & Forecasting online publication.