


SP500, DAX, FTSE - When Stock Markets Talk, Pay Attention
Stock-Markets / Stock Markets 2015 Aug 24, 2015 - 10:13 AM GMTBy: Michael_Noonan

 Unlike government supplied statistics, which are always favorably skewed to misrepresent the lies being told, markets do not lie, not even manipulated ones like the stock market, actually pick almost any market. We gave up on the S&P as our primary market coverage a few years ago, unable to abide by the then Permanent Open Market Operations that were the impetus behind keeping stocks propped up. Faux government support kept on building, but we could not abet and support being long to help out. Our absence never mattered, except in the loss of followers, but the reasons mattered to us.
We never pay any attention to market news, almost all of which is worthless. What bears paying the most attention to is the actual market itself, and when it "talks," in the form of developing market activity, we take heed.
Patiently, we have been waiting for the sell side, once a top is confirmed. It appears a top is forming. The protracted TR activity over the past year could be either re-accumulation, in preparation for going higher, or it could be distribution in preparation to go lower. The action has had more of the earmarks of distribution, but the false government support has skewed activity, preventing normal corrections from developing. That can only go on for so long, and it may be so long to that form of market interference.
Last week's sharp decline looks like a game-changer. There have been many signs of potential topping action, but none that were being confirmed. Friday was confirmation. That said, it also need be said that markets often take time to top out in the distribution process. As things stand, the onus will now be on buyers, actually just the Fed, to effect change from the damage just done.
Some of the highlights from the weekly charts will be covered, all mentioned on the chart.
The difference between 1 and 2 is like night and day in understanding developing market activity. It is the market speaking the market's language, composed of price and volume, there for anyone and everyone to see, but few do. Bar labeled 2 is seemingly stronger than bar 1. Bar 2 developed while a rally was in process, so it had a buyer's wind behind its back, as it were. Bar 1 was a recovery from a sell-off, confronting a seller's headwind.
Yet, the rally following bar 1 was considerably stronger than the already in progress rally of bar 2 that simply fizzled out. The market was sending a message.
In other words, the relative strength of bar 2 was showing weakness, instead. It is the market telling us to be cautious because something is not right. There was no reward for the effort, and that is a red flag. A red flag does not mean imminent danger, although it can, depending on context. This one was a warning that a change could soon follow. There was a change, but is was a very gradual, grudging rally.
We did not point out the tiny range bar that became the high in May. The small range with a mid-range close was a huge red flag. It was a very clear indicator that buyers were weak.
See how volume dropped, then. Sellers were present by preventing the range from extending higher, but they were not strong enough to overcome the inexorable, but failing efforts of the Fed propping up the market.
Bar 4 shows increased volume, more than the prior day, yet compare the results for that increased effort. There was hardly any to show for the higher volume, another sign of buyer fatigue wearing thinner and thinner. That day's high stopped at resistance, and the close was mid-range, again letting us know sellers were more than meeting the efforts of buyers when buyers should have been in total control. These are all messages. All that was lacking was confirmation that change was pending.
The overlapping bars, 5 week's worth prior to last week was another tell that there was a battle going on between buyers and sellers, just under resistance. Long story short, last week put to rest that the artificially propped-up market could stay propped-up forever.
The warning signs have been there, and we have cautioned buyers to not be in stocks for any reason, in prior months. It was and always has been a matter of time for change.
As an aside, the 100 point TR in the S&P, just since March, contained price swings totaling over 1,450 points. That kind of churning is a recipe for undue risk, also more of topping action than for continuation higher.
E-Mini S&p500 Weekly Chart
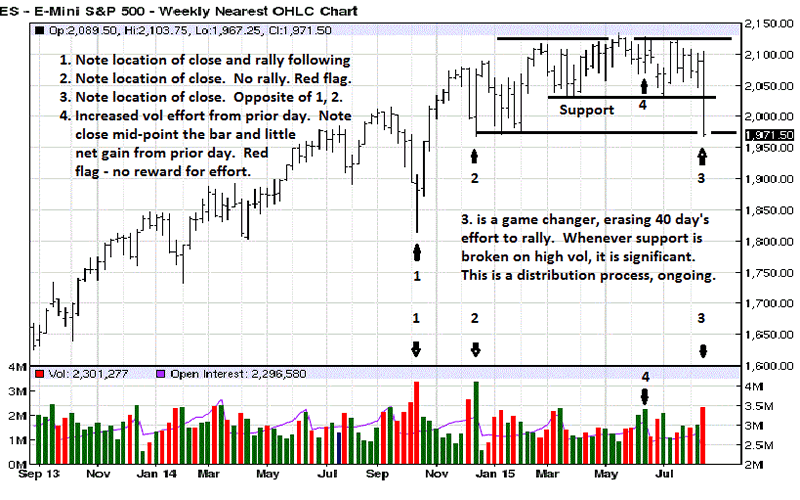
Note the small range bars forming the July high, and then look at the drop off in volume as the high was developing. Buyers were AWOL. We could spend hours dissecting these charts to relate what message the market was sending. Look at the wide ranges that were overlapping in early July. There was a HUGE struggle going on between buyers and sellers. Judging from the ensuing rally, one would think buyers prevailed.
After such fight between opposing forces, you would expect the victor, buyers, to be off and running, but all they did was run out of steam. That was a significant tell. From the end of July through most of August, there was another epic struggle, obvious by the overlapping bars, an overt clue once you understand what overlapping bars mean. 2100+ was now forming a minor resistance, and note how the 4th bar from the end failed as the last rally prior to last week's collapse. Small range, poor close, no demand. When there is no demand, it opens the door for sellers. Market reality made its presence known, last week. All of this transpired at the RHS of a protracted TR. [RHS = Right Hand Side, TR = Trading Range.]
Market resolve ALWAYS comes at the end of the RHS of a TR, a market truism. What can never be known is how long a TR will last, but the results will always show up in signs of strength or weakness, and the S&P had been flashing weakness for months. It takes patience to wait for confirmation, but waiting can save capital from undue risk exposure and prevent large losses when markets collapse, as they did back in 2008.
E-Mini S&p500 Daily Chart
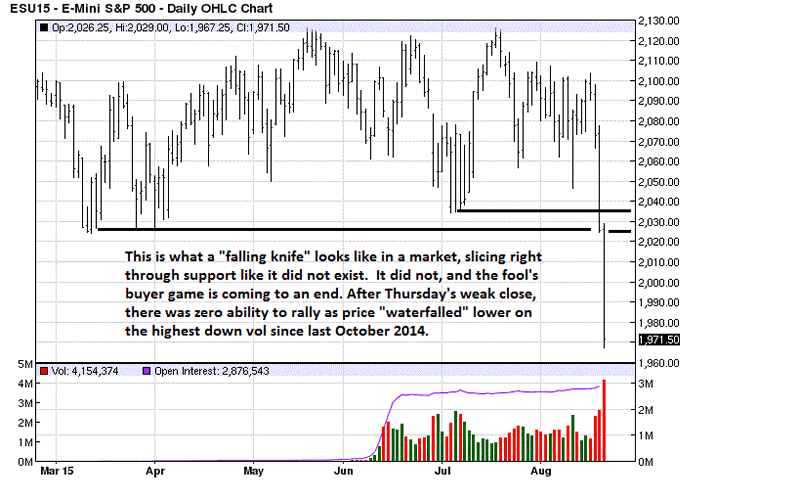
The chart comments are more of what we have been explaining, and for the chart-impaired, if you follow the simple logic behind the explanations, the market activity begins to make absolute sense from chart bars that many view as nonsense, primarily due to ignorance and no fault of the developing market activity story. It is all there, but it just goes unseen by seeing eyes.
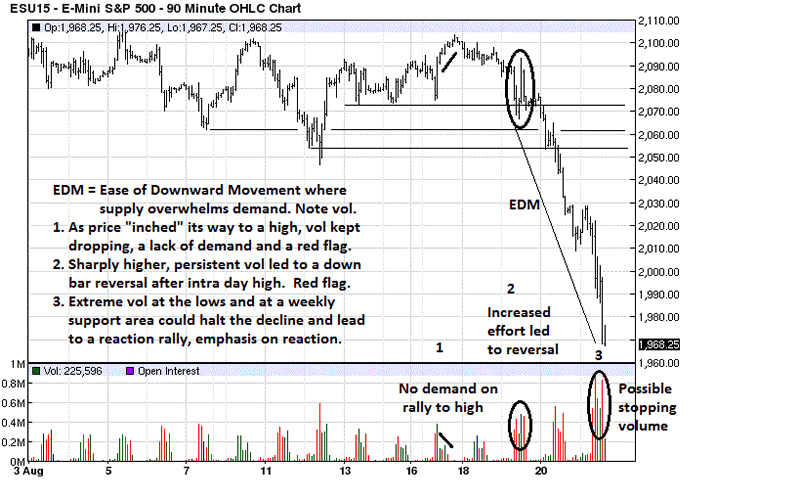
Time frames do not matter. Just as there was a weak rally into the high in July on the daily chart, there is a similar weak high on this 90 minute intra day chart at 1. If you knew in July what we expressed, it could have been put to use in mid-August. Weak demand opens the door for sellers. Sellers entered on the 19th, #2, where a high volume struggle took place and a downward reversal occurred at the end.
For those who paid attention, the struggle at #2 was also at the end of the RHS of a TR where breakouts of the TR happen. [The end of the TR was there. Did you see it, or did it remain visibly invisible?] The clue at 1 led to the clue at 2 which led to a break down in price. Was there any way to know how much or how far price could/would break down? Absolutely not. But, the beauty part is, one does not have to know the unknowable.
Just take direction from the message[s] of the market, and see where it leads. Sometimes, it can even lead to a loss, but that is less frequent and a cost of doing business.
Friday's high volume at the lows could be a form of stopping action, temporary, given the character of the decline. There could be more downside just as momentum follow through, but the high volume is a red flag that says a reaction, normal in any market, could develop.
This has been a hindsight analysis, even though we have given ample warnings in the past, just not knowing when a top would develop. What it does is give guides for where and when one could be a seller on weak reaction rallies, or rallies not so weak but end weakly as another sell-off develops.
Is a top in? Possibly, which is not a hedge answer. We just do not know, nor do we need to know. All that is needed is a read of developing market activity at key areas that make the probability of being on the right side of a trade higher than not. Those are actually good odds when the market message is clear.
We will be paying more attention to this market, moving forward.
E-Mini S&p500 90-Minute Chart
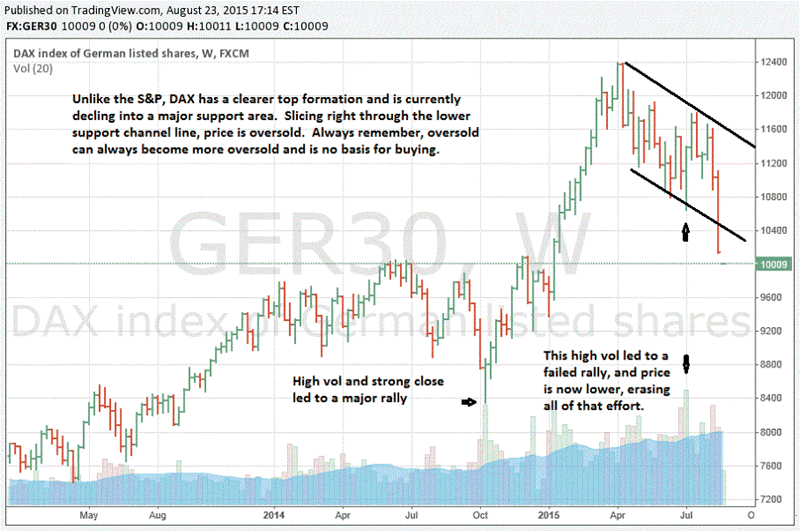
We also took a look at the two larger European markets, even if the Brits do not consider themselves as such. It was a surprise to see how much clearer the topping action has been for the DAX, a market we have obviously not followed for quite some time. The May breakdown and weak retest rally, 3rd week of July, was the tell, the clue, the red flag to look for reasons to sell.
The DAX is also declining into support. The play in all stock markets will be to look for signs of weakness in rallies as a place to short. As we say that, it does not presume a top has been totally confirmed, while more likely than not; we just happen to know what signs to look for and which ones to avoid. We do not follow the DAX closely, but if we happen to see something, we will share it.
DAX Weekly Chart
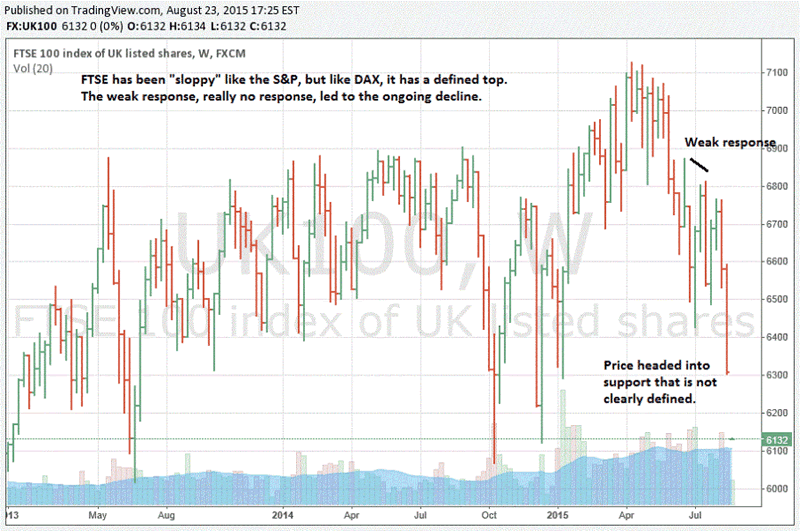
Finally, the FTSE which has been more akin to the S&P with overlapping bars and testing of one's patience. The high was followed by overlapping bars, a clue for potential change, as well as a clustering of closes, another clue for potential change. The failed rally effort on increased volume in April spoke volumes.
There is a reason why we say the best and most reliable information comes from the market itself. It is also the most reliable, for it never lies, and many trading opportunities lie within those messages.
You can always send questions [reasonable ones] to mn@edgetraderplus.com
Cheers...
FTSE 100 Weekly Chart
By Michael Noonan
Michael Noonan, mn@edgetraderplus.com, is a Chicago-based trader with over 30 years in the business. His sole approach to analysis is derived from developing market pattern behavior, found in the form of Price, Volume, and Time, and it is generated from the best source possible, the market itself.
© 2015 Copyright Michael Noonan - All Rights Reserved Disclaimer: The above is a matter of opinion provided for general information purposes only and is not intended as investment advice. Information and analysis above are derived from sources and utilising methods believed to be reliable, but we cannot accept responsibility for any losses you may incur as a result of this analysis. Individuals should consult with their personal financial advisors.
Michael Noonan Archive |
© 2005-2022 http://www.MarketOracle.co.uk - The Market Oracle is a FREE Daily Financial Markets Analysis & Forecasting online publication.