


Gold, Silver Precious Metals: a Critical Week Ahead
Commodities / Gold and Silver 2015 Oct 05, 2015 - 10:32 AM GMT

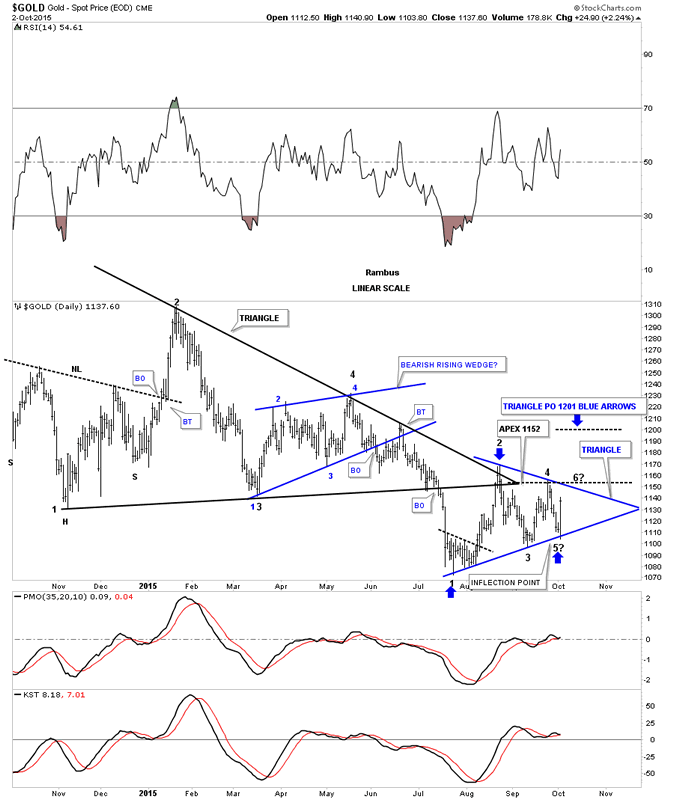
 Lets get right to the charts today as there is so much to cover. Starting with the daily gold chart you can see the blue triangle pattern we've been watching now for several weeks or so. Last Thursday gold closed right on the bottom rail which I knew was an inflection point where it could go either way. When I went to bed Thursday night I knew Friday was going to be either a very good day or a very bad day depending on what gold did in the morning. As you can see on the chart below gold dipped slightly below the bottom blue rail and then reversed direction to the upside. That last touch of the bottom blue rail confirmed the 4th reversal point was complete. The rally on Friday is now the beginning of the 5th reversal point which will make the blue triangle a reversal pattern instead of a consolidation pattern if it breaks out above the top blue rail.
As I have stated many times an even number of reversal points creates a consolidation pattern and an odd number of reversal point makes a reversal pattern. The fifth reversal point will be completed if the top blue rail gets hit. That will be another inflection point where gold can breakout and continue to rally or reverse back down creating the 6th reversal point. It looks like the 1152 area will be the place to watch as the apex of the much bigger black triangle consolidation pattern and the top rail of the blue triangle come together. If gold breaks out above the top rail of the blue triangle the measured move would be up to the 1201 area as shown by the blue arrows. The bottom line is gold is still chopping around in the blue triangle which is an indecision area where the bulls and the bears are fighting it out for dominance. Keep in mind this is only a battle within the bear market war.
Gold Daily Chart
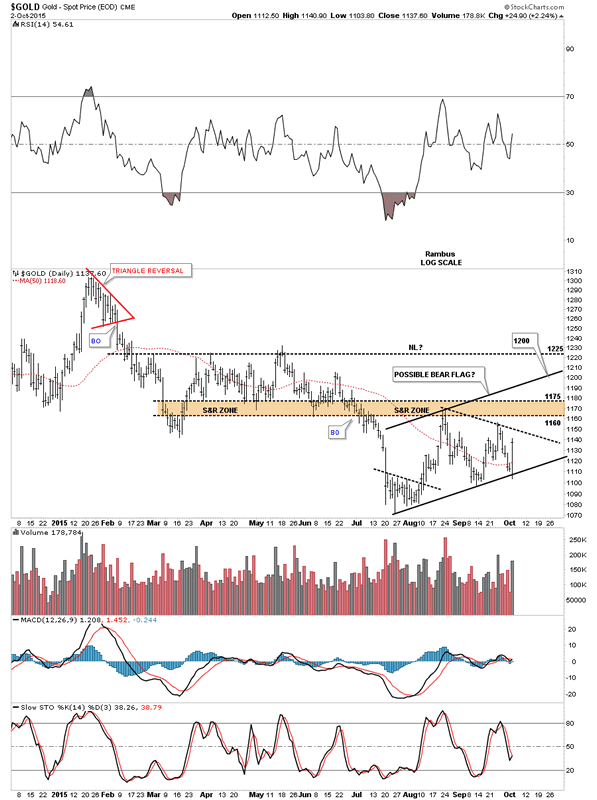
Below is another daily chart that shows if gold does indeed takes out the top rail of the blue triangle, that has a price objective up to the 1200 area, it's possible that gold may form a bigger bear flag which would still be bearish. Note the brown shaded support and resistance zone that is just overhead between 1160 and 1175 that gold will have to take out to reach the 1200 area. I know there are a lot of folks getting bullish on gold right now. If and that's a big IF, if gold can rally straight up slicing right through the brown shaded S&R zone and close somewhere in the vicinity of the previous highs made at 1225 that would be showing considerable strength and would be the first step in forming a possible inverse H&S bottom. At this point that is the most unlikely scenario but one to watch.
Gold Daily Chart 2
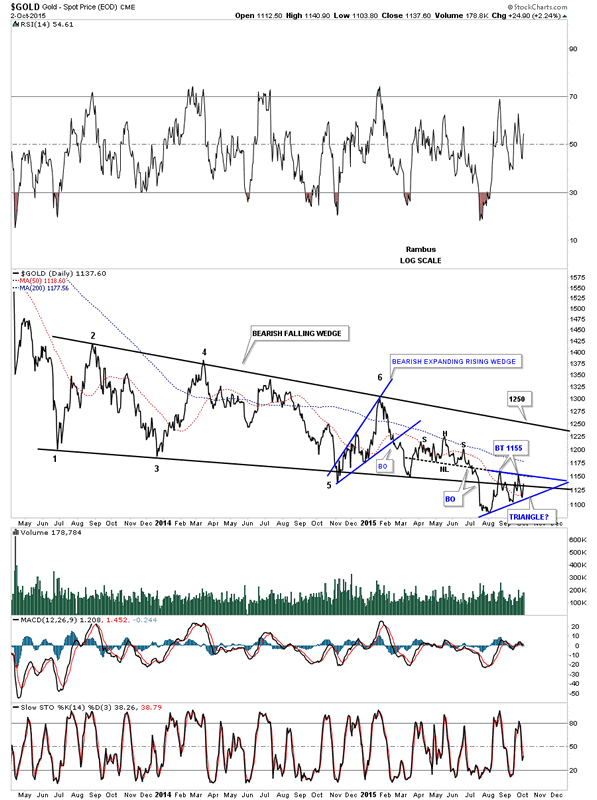
Below is a 2 1/2 year daily line chart for gold which shows the big picture with the bearish falling wedge with the blue triangle forming right on the bottom black rail. The last pattern that formed inside the big falling wedge was a H&S consolidation pattern that led to the initial breakout of the black falling wedge. Gold has backtested the neckline twice so far from below at the 1155 area which so far has held resistance.
Gold Daily Chart 3
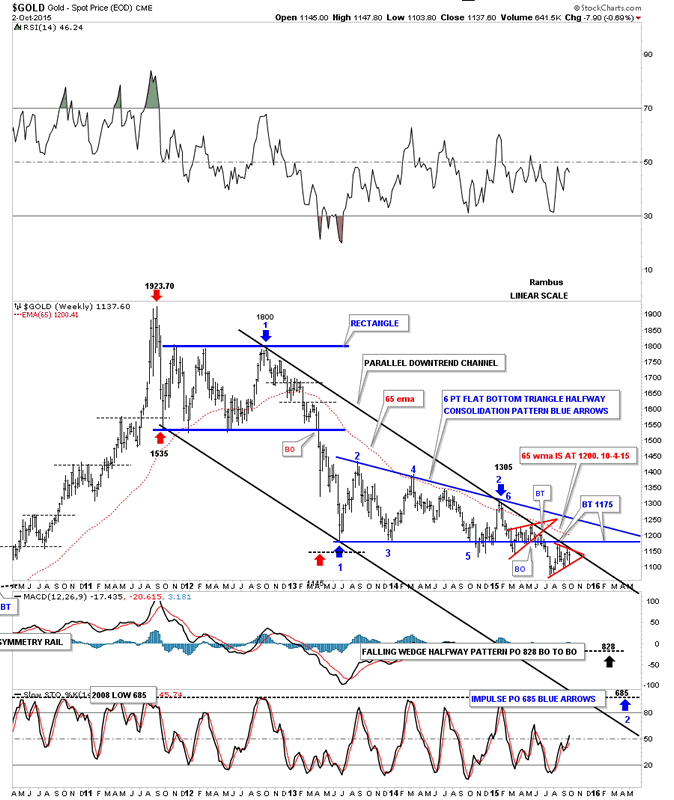
This weekly linear scale chart we've been following for a very long time now which shows the parallel downtrend channel gold has been in since topping out four years ago in 2011. For me this is the most important chart to keep a close eye on. I've made one slight adjustment on this chart and that is to the bottom rail of the blue two plus year bearish falling wedge. The reason I've done that is because of the two smaller red consolidation patterns that have formed just below the top rail of the black parallel downtrend channel. By making the bottom rail of the 2 plus year consolidation pattern horizontal you can see how the two small red consolidation patterns form one above and our current red triangle is forming just below that important bottom rail of the blue now six point descending triangle at 1155 or so. I will say it again so please don't get mad at me. If you see a smaller consolidation pattern form just above, just below, right on top or one on top and one below an important trendline that is usually a bearish setup in this case. If gold was in a bull market it would be a bullish setup. So by making the bottom rail of the large blue falling wedge horizontal we still have 6 reversal points with the bottom rail being a little sloppy which can happen with very large patterns. If you study the area between the two small red consolidation patterns you will see how the high in our current red triangle backtested the bottom blue rail of the flat bottom triangle or descending triangle, at 1175, which is by nature a bearish pattern because of the lower highs at each reversal point. The small red triangle is the same triangle I showed you on the first daily chart for gold. To say this is critical resistance at 1155 or so is an understatement.
Gold Weekly Chart
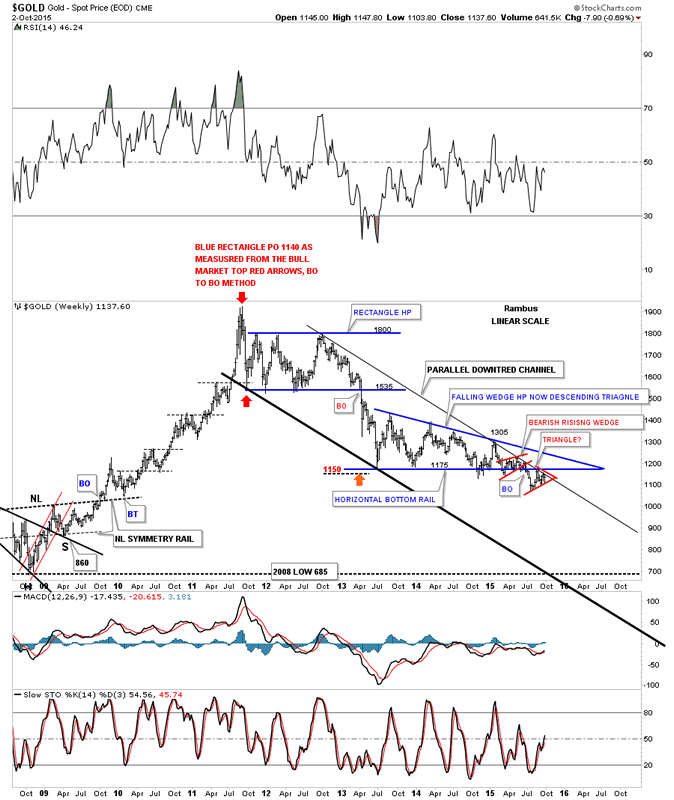
Below is a close up look at the four year parallel downtrend for gold which shows the blue flat bottom triangle consolidation pattern as a halfway pattern to the downside as shown by the blue arrows. The price objective still remains the same using the impulse method as shown by the blue arrows. Blue arrows #1 measures the first impulse move down and the blue arrows with the number #2 measures the second impulse move down which is the 2008 crash low at 685. Using the horizontal bottom rail now for the big blue consolidation pattern the breakout to breakout method gives us a higher price objective up to the 828 area. The 65 week moving average now comes in at 1200.
Gold Weekly Chart 2
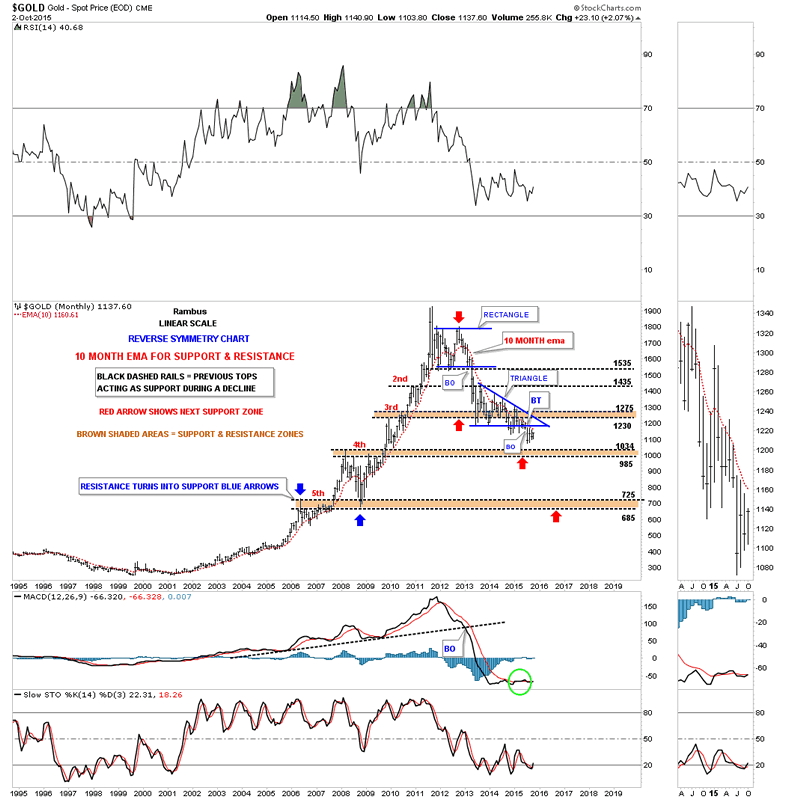
This next chart is a very long term monthly chart for gold which I use the 10 month ema to look for support and resistance. As you can see it did a beautiful job of nailing the bottoms during the bull market years except for the 2008 crash. It has done a pretty good job during our bear market at showing us resistance. There are just two months where the price action closed above the 10 month ema and that was during the formation of the blue triangle consolidation pattern. If you look real close you can see that the highs in August and September touched the 10 month ema and declined. The 10 month ema now comes in at 1160 which is now below the bottom rail of the blue triangle.
Gold Monthly Chart
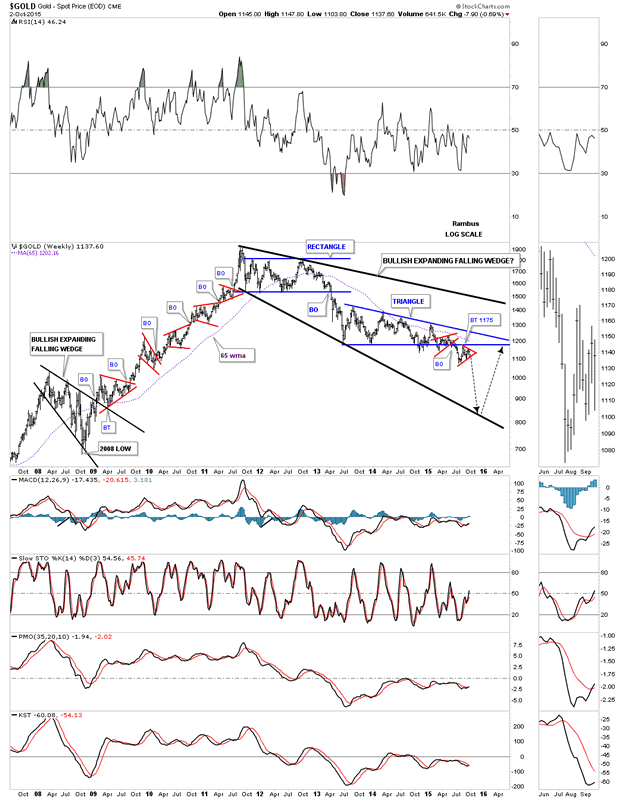
Below is a long term weekly log scale chart for gold which shows how the bull market that began in 2000 could still be intact if the big four year bullish expanding falling wedge plays out. The low would be where ever the bottom black rail is hit which right now is around 800 but its dropping so the longer it takes the lower the ultimate price objective. Note the smaller black bullish expanding falling wedge which created the consolidation area for the 2008 crash low. It had six complete reversal points before it was finished developing. Note the breakout and backtest which took roughly 12 weeks to complete before the final leg up to the all time high began in earnest. Also note that a six point red triangle that formed as part of the breaking out and backtesting process on top of the all important top rail of the bullish black expanding falling wedge. Our current small red triangle is forming just below the all important bottom rail of the two plus years blue flat bottom triangle consolidation pattern. If you look at the first chart of this post you will see a closeup view of the small triangle consolidation pattern that is possibly working on its sixth reversal point if the top rail holds resistance.
Gold Weekly Chart 3
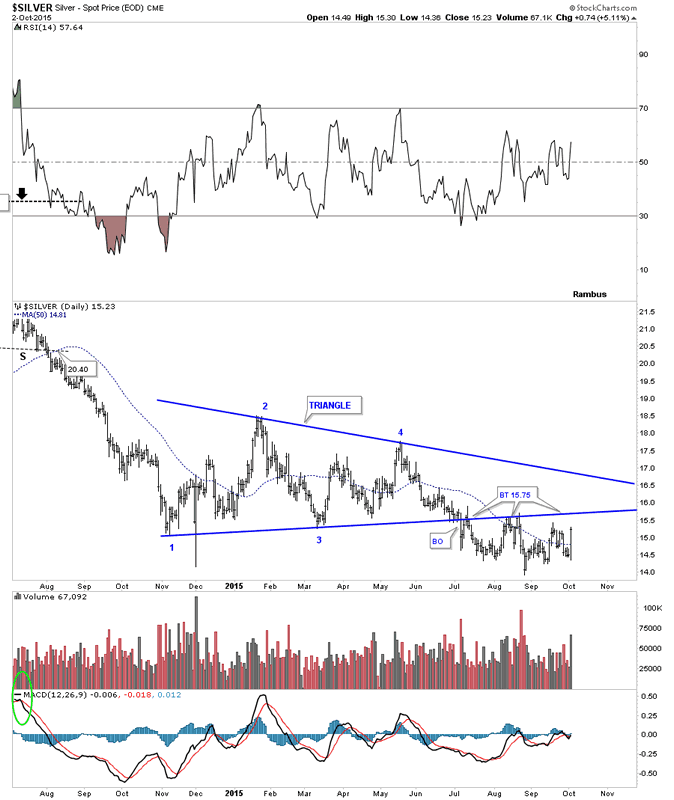
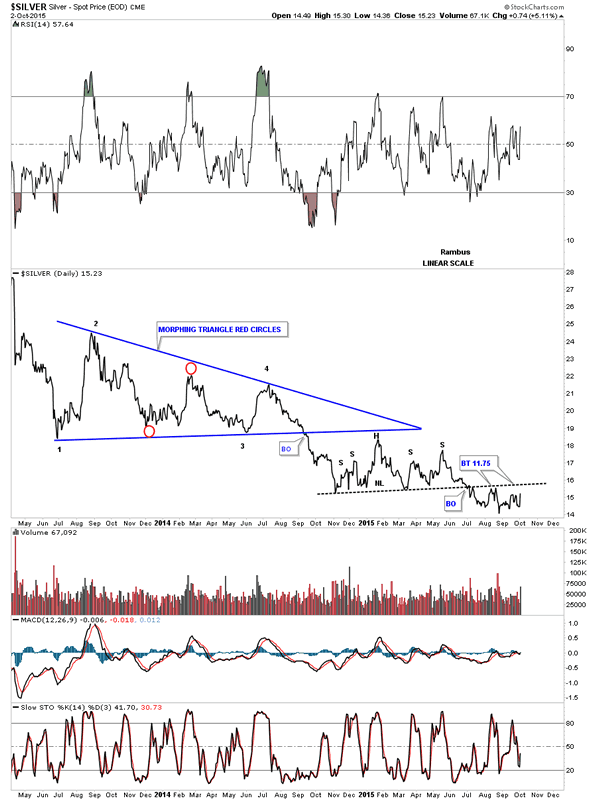
Now lets take a look at a daily chart for silver which shows the previous consolidation pattern was a blue four point triangle. So far silver has backtested the bottom blue rail several different times and it maybe getting ready to do it again. A backtest would come in around the 15.75 area. I've also been showing this area as a H&S consolidation pattern. The main thing to focus in on is the bottom rail as that is our line in the sand whether it's a neckline or the bottom rail of a triangle consolidation pattern. I could make a case that the area trading below the bottom rail of the blue triangle could be an inverse H&S bottom. If that is the case then silver will have to break above the bottom rail of the blue triangle. Until that happens, above the bottom rail is positive and below is negative.
Silver Daily Chart
The next chart for silver is a daily line chart that shows the blue triangle and the H&S consolidation pattern that has formed just below the bottom rail with a backtest price objective up to 15.75 or so.
Silver Daily Chart 2
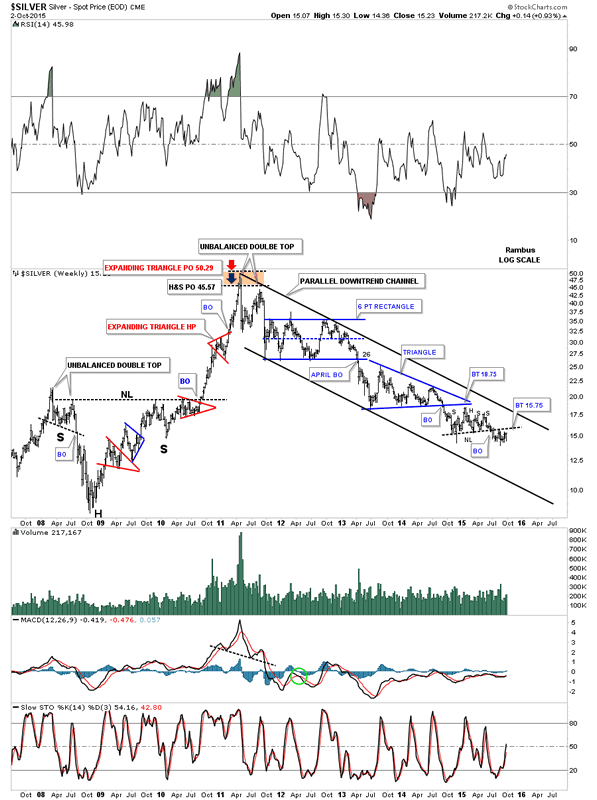
Below is a long term weekly chart for silver which shows us it too has a parallel downtrend channel that has formed since it put in its bull market high in April of 2011. This chart I'm showing our latest consolidation pattern as the H&S consolidation pattern that has formed just below the bottom rail of the previous blue triangle. This chart has classic Chartology written all over it. You can see the 2008 crash low ended up being just the head of a big H&S consolidation pattern. Note the little red triangle that formed just below the neckline which led to the vertical move up into its bull market top at 50 or so. The little red expanding triangle, that formed right in the middle of that huge impulse move up, signaled the halfway point which measured up to 50.29. The big H&S consolidation pattern measured up to 45.57 which gave me a nice target to look for. Compare how much easier the price action was to trade during the bull market compared to our current bear market. The rally out of the 2008 crash low was punctuated by several small consolidation patterns whereas the bear market has consisted of big consolidation patterns that took a long time to show their hand. When I look at this weekly chart it's very hard to find anything bullish. The very first thing I would need to see is for silver to trade above the neckline at 15.75 and then above the top rail of the downtrend channel. If silver can do that I will have no problem at all being bullish again like I was during the bull market years.
Silver Weekly Chart
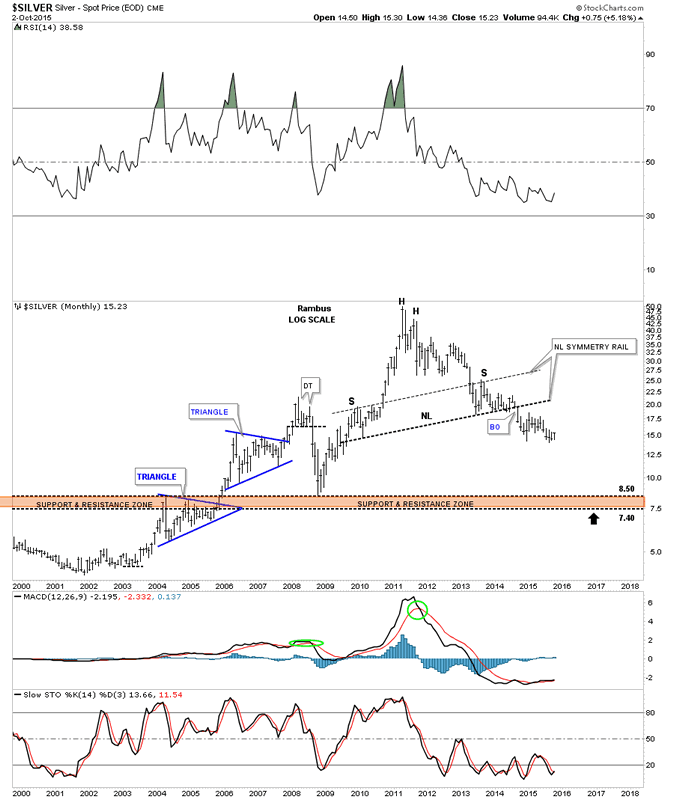
The last chart we'll look at for silver is the long term monthly look that shows a nice symmetrical H&S top as shown by the neckline symmetry rail. The price objective for that massive H&S top is down to the brown shaded S&R zone at the bottom of the chart. I know it seems impossible but that's what the Chartology is strongly suggesting. What will be the fundamental reason for that is anybodies guess. We'll know well after the fact why silver and the rest of the precious metals complex were so weak but right now all I can show you is the charts that are telling us this sector is in very bad shape even after four years of a bear market.
Silver Monthly Chart
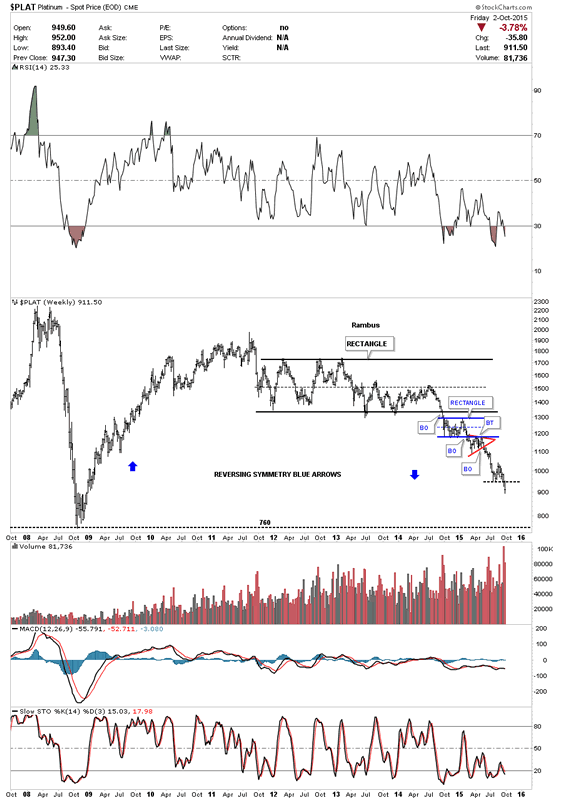
Lets look at one last chart for tonight which will be the weekly look at Platinum. It tends to march to its own drummer but its considered a precious metal along with an industrial metal similar to silver. Like almost all commodities it topped out in 2011 and then formed its first consolidation pattern which is the black three year rectangle. After breaking out of the big black rectangle Platinum formed a smaller blue rectangle just below the bottom rail of the big rectangle. Next Platinum formed a small red triangle just below the bottom rail of the small blue rectangle. Its taken alot of chopping around to gain ground to the downside but as you can see last weeks bar was pretty long as it broke to multi year lows. It appears to be reversing symmetry to the downside. How it went up in the bull market years is how its coming back down in the bear market years.
This is going to be a very interesting week for the precious metals complex as a lot of important areas of resistance are getting close to being tested. How this testing goes will tell us a lot of how strong the PM bulls are at this time. If they're are for real then they will show us by taking out some of the overhead resistance. Until they can do that I have to respect the bear market that has been in place for well over four years now. All the best...Rambus
Platinum Weekly Chart
All the best
Gary (for Rambus Chartology)
FREE TRIAL - http://rambus1.com/?page_id=10
© 2015 Copyright Rambus- All Rights Reserved
Disclaimer: The above is a matter of opinion provided for general information purposes only and is not intended as investment advice. Information and analysis above are derived from sources and utilising methods believed to be reliable, but we cannot accept responsibility for any losses you may incur as a result of this analysis. Individuals should consult with their personal financial advisors.
© 2005-2022 http://www.MarketOracle.co.uk - The Market Oracle is a FREE Daily Financial Markets Analysis & Forecasting online publication.