


Financial Markets Calm Before the Storm?
Stock-Markets / Financial Markets 2015 Oct 09, 2015 - 12:05 PM GMTBy: Puru_Saxena

 BIG PICTURE - Global business activity is slowing down and the majority of the developing nations are experiencing severe economic problems. Over in the developed world, Japan is contracting again, Euro zone is barely growing and even America's leading economic indicators are suggesting trouble ahead. Elsewhere, the CRB Index is trading at a 13-year low and this implosion in the prices of commodities is suggesting that all is not well with the global economy.
The crux of the matter is that the world is severely over-indebted (debt to GDP ratio of 286%, Figure 1) and without fiscal measures, viable reforms and debt restructuring, we will probably remain stuck in this low growth environment for years. Unfortunately, you cannot solve a problem of too much debt by encouraging even more borrowing; yet policymakers are trying to fix this mess by lowering interest rates and injecting liquidity.
Figure 1: Global stock of debt outstanding (US$ trillion)
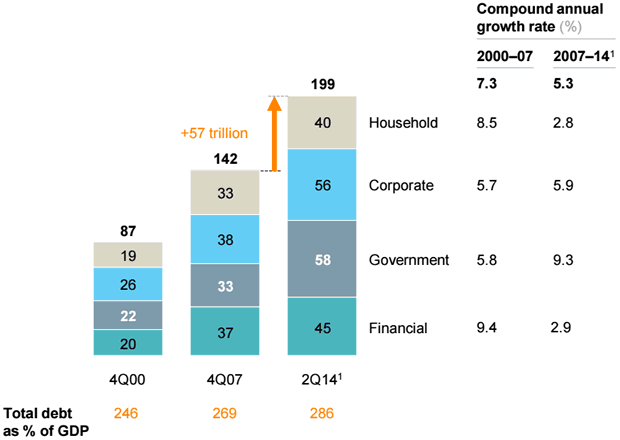
Source: McKinsey & Company
Make no mistake, the US housing boom and subsequent financial crisis of 2008 were caused by the Federal Reserve's easy monetary policies which were put in place after the TMT bust. By dropping rates to emergency levels and keeping them there for years, Mr. Greenspan spawned the US housing bubble which almost destroyed the world's banking system. So, by keeping its Fed Funds Rate at zero since late 2008, it is ironic that the Federal Reserve is (once again) walking down the same path!
It is notable that even though the Federal Reserve's monetary policy has been extremely accommodative since the global financial crisis; the recovery in the US has been sub-par when compared to the previous economic cycles (Figure 2).
This is due to the fact that despite the carrot of record-low borrowing costs dangling in front of them, American households have refused to take the bait. Instead, they have done the sensible thing and deleveraged their balance-sheets.
Figure 2: US nominal GDP (1948-2014)
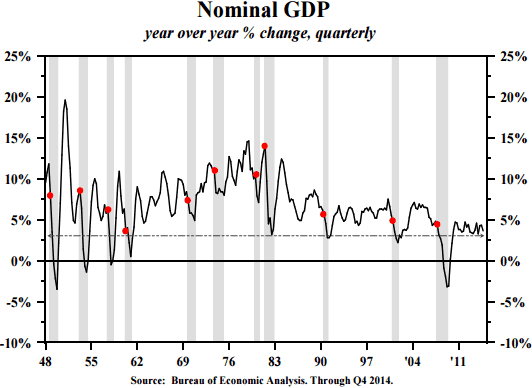
Source: Hoisington
Today, the household debt to GDP ratio in the US is 80%, well below the 100% level reached in 2008. This meaningful decline demonstrates that the Federal Reserve's ultra-accommodative monetary policies have done very little in terms of boosting household borrowing and consumption.
Instead, by dropping short-term rates to zero and keeping them there for 7 years, this time around, the Federal Reserve has succeeded in spawning new bubbles in the corporate sector, which pose a serious threat to the economy. Presented below is a list of the obvious corporate bubbles:
- US Corporate debt - US$5trillion (+ US$2 trillion since 2007)
- High yield (junk) bonds and leveraged loans - US$2.2 trillion (+ US$1.2 trillion since 2007)
- Biotechnology - 7-fold increase in NASDAQ Biotech Index; most companies have no earnings
In addition to the above excesses in the corporate world, the Federal Reserve's zero interest rate policy (ZIRP) has also blown the following domestic bubbles:
- Student loans - US$1.2 trillion (+ US$0.7 trillion since 2007)
- Auto loans - US$1 trillion (+ US$0.4 trillion since 2009)
Last but not least, the Federal Reserve's monetary policy has also inflated these international bubbles:
- Commodities boom and subsequent bust
- Commodities exporters' boom and bust (Australia, Brazil, Canada and Russia)
- Singapore property
- Stock markets of Indonesia, Philippines and Thailand
- Hong Kong property - HK$1.044 trillion mortgage debt (+ 76% since 2009)
In terms of the Hong Kong property market, although most experts and talking heads on TV remain convinced there is nobubble, research from the Hong Kong Monetary Authority (HKMA) shows that housing has become extremely unaffordable. If you review Figure 3, you will note that the housing price-to-income ratio has now risen to a record high of 15.9 and it is even higher than the 1997 peak of 14.6. Meanwhile, the income-gearing ratio has increased further to 70.7%, well above the long-term average of 50%. According to the HKMA, if the mortgage interest rate returned to a more normal level, say an increase of 300-basis points, the income-gearing ratio would soar to 95%!
Figure 3: Indicators of Hong Kong housing affordability
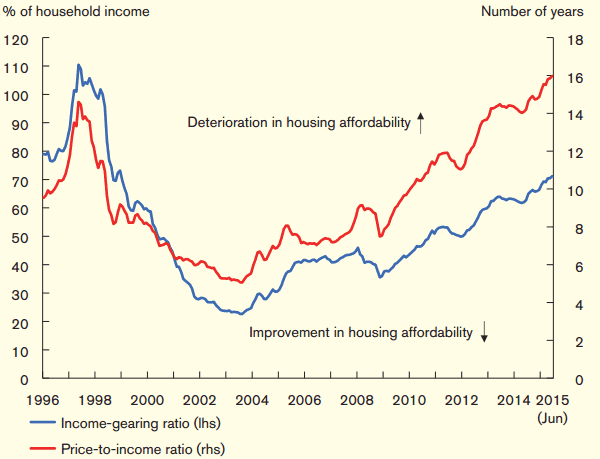
Source: Hong Kong Monetary Authority
Today, many Wall Street firms, prominent hedge fund managers and academics are putting forward arguments as to why the Federal Reserve should not raise the Fed Funds Rate. In their eyes, the macro-economic conditions are too uncertain to even warrant a 25bps rate hike.
In our view, these folk are dead wrong because unlike Europe and Japan, the US economy does not need ZIRP. If our assessment is correct, the longer the Federal Reserve stays on hold, the bigger will be the eventual bust.
Turning to the stock market, it is our contention that the bull market on Wall Street ended in May and we are now in the early stages of primary downtrend. You will recall that the US stock market fell sharply in mid-August and since then, it has gyrated within a wide trading range. To the casual observer, these wild swings may not make much sense but closer inspection reveals that there is indeed a method to the stock market's madness.
If you review Figure 4, you will note that between late February and early August, the S&P500 Index carved out an enormous rounding top formation; which culminated in the plunge below the key support levels (shaded areas on the chart). Thereafter, in late August, the relief rally faded around the lower support (now resistance) level. The S&P500 Index then spent two weeks in a sideways grind and the next rally attempt also ended at the same overhead resistance. Following this failed rally attempt, the S&P500 Index re-tested its August low and over the past few trading sessions, it has put together another advance.
Figure 4: S&P500 Index (daily chart)
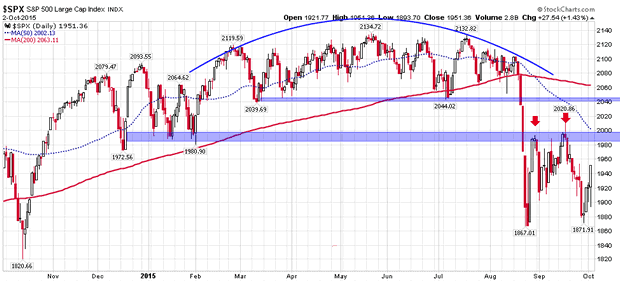
Source: www.stockcharts.com
At this stage, nobody knows when this bounce will end but if we are in a primary downtrend, the rally should fade around overhead resistance level (2000-2040). Under this scenario, the next leg down will probably take out the August-low and trigger a waterfall decline. Currently, we cannot guarantee how low the S&P500 Index might fall; but we see support in the 1,700-1,740 area. So, if our bear market hypothesis is correct, then the ongoing rally will end soon and give way to the next wave of selling.
Look. There are no certainties when dealing with the future, but our work leads us to believe that the bull market is now in the rear view mirror and the odds of new highs over the following months are slim to none. Our bearish prognosis stems from the following data points:
- S&P500 Index is below the 50-day and 200-day moving averages which are pointing down
- NYSE Advance/Decline Line peaked in April (prior to the stock market peak in May + July)
- Our proprietary trend following filter is now flashing 'downtrend'
- NYSE Bullish Percent Index has dropped to just 31%
- The High yield (junk) bond ETF has taken out the August-low
- Only 22% of the NYSE stocks are trading above the 200-day moving average
- Biotechnology - The leading sector of the bull-market has topped out (Figure 5)
- Russell 2000 Small Cap Index and Russell 2000 Growth Index have taken out the August low
- Out of the 35 industries we monitor, just 6 are trading above the 200-day moving average
- Leading stocks are declining on good 'news', indicating the best has been discounted
- Stocks are declining despite ongoing QE in Europe and Japan
- Stocks are declining despite no rate hike and a 'dovish' Federal Reserve
- Volume is rising on down days and falling on up days
Bearing in mind the above price and volume data, we are almost certain that the primary trend for equities is now down and global stock markets remain vulnerable to heavy declines.
Figure 5: NASDAQ - Biotechnology Index
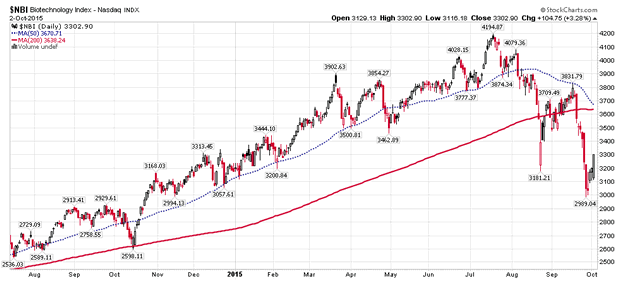
Source: www.stockcharts.com
Given the weak technical picture and worsening economic backdrop, we currently have no exposure to risky assets (commodities, high yield debt and stocks). Instead, we have invested our managed capital in the following manner:
- Long dated US Treasuries & Zero Coupon Bonds - 40% allocation
- Short-term US Treasuries - 35% allocation
- Short positions (biotechnology, industrials and technology) - 15% allocation
- 'Long' US Dollar position - 5% allocation
- US Dollar cash - 5% allocation
If our analysis of the situation is even vaguely correct, our managed portfolios will do well in the looming deflation and our strategy should outperform our benchmark (MSCI AC World Index) by a wide margin. Conversely, if stocks continue to rally (unlikely scenario) and our primary trend filter flips to 'uptrend', we will promptly re-position our managed accounts.
Puru Saxena is the CEO of Puru Saxena Wealth Management, his Hong Kong based SFC regulated firm which offers discretionary portfolio management and research services to individual and corporate clients. The firm manages two trend-following strategies – Discretionary Equity Portfolio and Discretionary Fund portfolio. In addition, the firm also manages a Discretionary Blue-chip Portfolio which invests in high-dividend world leading companies. Performance data of these strategies is available from www.purusaxena.com
Puru Saxena also publishes Money Matters, a monthly economic report, which identifies trends and highlights investment opportunities in all major markets. In addition to the monthly report, subscribers of Money Matters also receive “Weekly Updates” covering the recent market action. Money Matters is available by subscription from www.purusaxena.com
Puru Saxena
Website – www.purusaxena.com
Puru Saxena is the founder of Puru Saxena Wealth Management, his Hong Kong based firm which manages investment portfolios for individuals and corporate clients. He is a highly showcased investment manager and a regular guest on CNN, BBC World, CNBC, Bloomberg, NDTV and various radio programs.
Copyright © 2005-2015 Puru Saxena Limited. All rights reserved.
Disclaimer: The above is a matter of opinion provided for general information purposes only and is not intended as investment advice. Information and analysis above are derived from sources and utilising methods believed to be reliable, but we cannot accept responsibility for any losses you may incur as a result of this analysis. Individuals should consult with their personal financial advisors.© 2005-2022 http://www.MarketOracle.co.uk - The Market Oracle is a FREE Daily Financial Markets Analysis & Forecasting online publication.