


Gold and the Ancient Sequence of Market Numbers
Commodities / Gold & Silver Jul 01, 2008 - 10:13 AM GMTBy: John_Needham

 Passion and Precision
Most Gold traders are also Gold buffs. As the oldest form of money known to man and the first step past a basic bartering system in our civilization's development, Gold and Silver occupy a special place in our psyche, thus it is not surprising that many traders are passionate about the commodity they trade. Passion in all its forms is more pleasurable in anticipation than reality, a concept that gains acceptance with age, but there are times when anticipation will not suffice and precision is demanded. So it is with the world of trading.
Whether you are an investor looking to position a trade for the long pull or a trader seeking the swing points, that vital piece of information is the same. “Where is this going and where will it turn”. A more discriminating investor may be concerned with longer term trend signals. For investors as opposed to traders, reliability rather than immediacy is the key. Gold is one of the better markets to trade as it is a highly technical market that turns where it should if you know where to look. Today I want to share with you a unique view of support and resistance levels that work in all markets and for which Gold has a particular affinity.
Long term signals
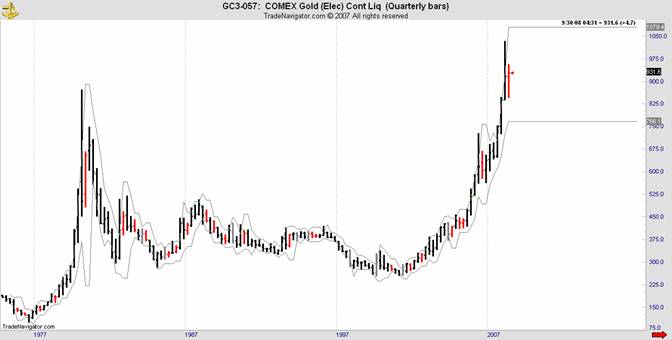
The matrix that controls all markets is the Danielcode (DC). This is an ancient but relatively newly discovered sequence of market numbers that run from zero to infinity. They are created from market structures and therefore differ for each chart. They are dynamic in the sense that they are fractals of previous market moves. Whilst in theory there are unlimited sequences, in practice, markets use a handful of sequences again and again. For long term signals, we take the closest fit DC ratio and project it against an arc representing the dominant operating range. What we get is some squiggly lines that look like a Bollinger band or a Keltner Channel but are in fact DC binomials. This is a quarterly chart to show you how the binomials expand and contract with volatility.
To create market signals for investors as opposed to traders, we use monthly and weekly charts. The protocols that govern this methodology create a “count” from which we get buy and sell signals. We also get precise market data points at which the signal will fail so there is a high degree of rigor attached to this form of analysis. Our default assumption is that when both the weekly and monthly chart are on the same signal (buy or sell) the market is trending. When the signals are not in agreement we assume the market is correcting or consolidating.
DC Targets
Of more interest to most traders is the use of the DC support and resistance levels as potential targets for market moves. One of the unique and valuable features in the DC program is that bars in all time frames will complete their “recognition” of a Daniel number sequence by making their high/low within a small variance from the DC number. For Gold this variance is 3 points. We call bars that comply with these pre-conditions “setup” bars.
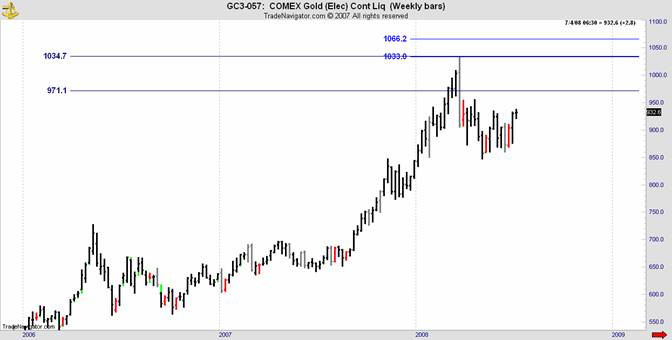
This is the weekly chart of Comex Gold leading up to the March high. We had two key numbers to consider but only one bar, that of the week ending 03/21/08 , met the conditions of a DC setup bar. In actuality the number from the daily chart was 1034.10 just 2 ticks from the ultimate high and this number was published for clients at the Danielcode Online and to a critical audience at an award winning US web magazine.
From the 17th March high the DC numbers projected these choices for the next major turn as shown on the chart below. 870 and 845 were both “must know” numbers. I have left some of the DC numbers on the following chart to show you how all of the significant turns in Gold have been made at or near the DC price targets.
I cannot show you all the detail here as this is a continuous chart covering four separate Comex contracts and for precise detail we need to look at each of the Comex charts. What I can tell you is that since the beginning of the year, every swing on the daily chart has been made at or within three points of the appropriate DC number except for one swing that came a little over four points away.
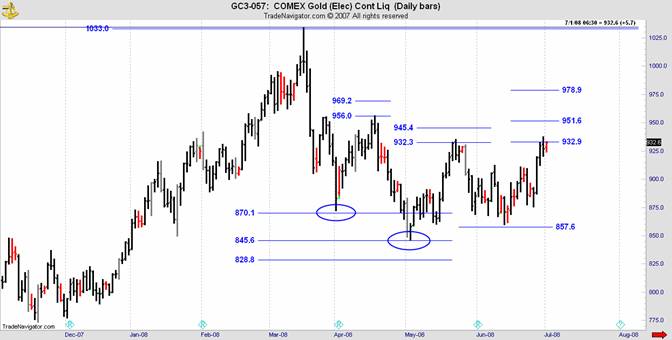
If we consider only those bars that are a valid Daniel number “setup” bar we discard over 80% of daily bars as potential turn points and an even higher percentage on the weekly chart.
The One More Thing
For 15 years I wondered why markets turned where they did. I knew about fibs and other range extension techniques and of course retracements, but nothing I could find in my searches gave me certainty or precision and so I searched until I found one more thing. The Danielcode is that “one more thing”. It is to the best of my knowledge the only totally new form of market analysis in a generation. It works on all markets in all time frames, which is why those that know say that markets are ruled by the Danielcode.
By creating a number sequence that markets know but others do not see, it not only adds that level of certainty that is missing from traditional analysis but because it is new and relatively unknown, it provides you with market information that others do not have. Whenever you know something that the market at large does not, you have an edge. And that is the difference between being with the crowd and being ahead. Markets know and react to these numbers. Sometimes the reaction is a mere vibration, sometimes it is a turn. We can use standard analytical tools to determine which reaction we are likely to get.
I have a plethora of testimonials that hail the Daniel number sequence as new, unique and brilliant. Personally I have found that any worthwhile journey must start with my own search and so I invite you to visit the Danielcode Online to begin your search of all the turning points for Gold. It is an exciting journey to see these secret market levels revealed.
By John Needham, The Daniel Code Report | July 2, 2008
See http://www.thedanielcode.co.uk for the full article and for more information about DC Numbers including a free two week trial .
John Needham is a Sydney Lawyer and Financial Consultant. He publishes The Danielcode Report and writes occasionally on other markets. He lives with his family in Australia and New Zealand .
John Needham Archive |
© 2005-2022 http://www.MarketOracle.co.uk - The Market Oracle is a FREE Daily Financial Markets Analysis & Forecasting online publication.