


Corn Commodity Price Popping Higher
Commodities / Agricultural Commodities Nov 24, 2015 - 12:12 PM GMTBy: Austin_Galt

 The corn price finally looks set to pop a lot higher so let's look at the short term action with the daily chart and then refresh ourselves of the long term outlook which remains unchanged.
Corn Daily Chart
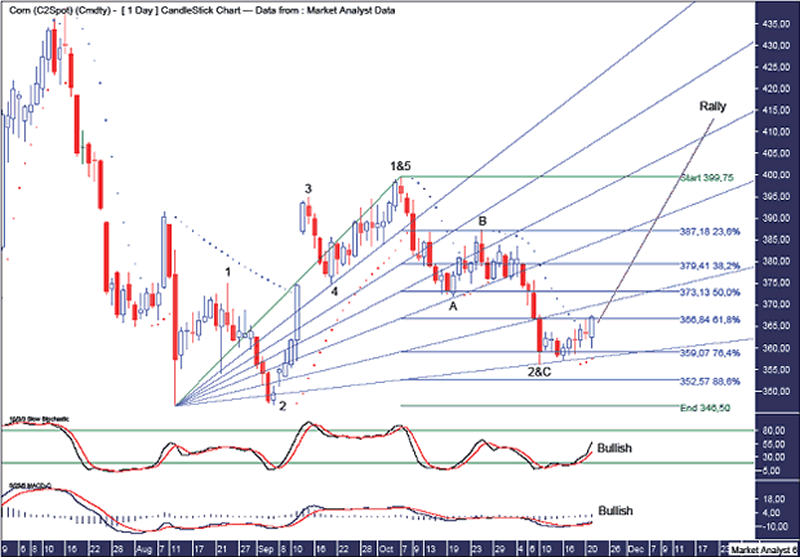
I have added some Elliott Wave annotations to show how I view the current price structure. It shows the move up from the August 2015 low consisted of five waves ending in the wave 1 high. We have just witnessed and ABC correction to put in a wave 2 low. That means we are now in wave 3 which is often the most impulsive wave.
The PSAR indicator has a bullish bias with the dots beneath price.
Today's bullish outside candle looks very strong and I expect some solid follow through to the upside.
I have added Fibonacci retracement levels of the move up from low to wave 1 high. The first correction in a new bull trend often makes a deep retracement and that was certainly the case here with the wave 2 low in between the 76.4% and 88.6% levels.
I have drawn a bullish Fibonacci Fan and the wave 2 low was bang on support from the 88.6% angle. Nice.
The Stochastic and MACD indicators are both bullish.
Let's now revise the long term picture using the monthly chart.
Corn Monthly Chart
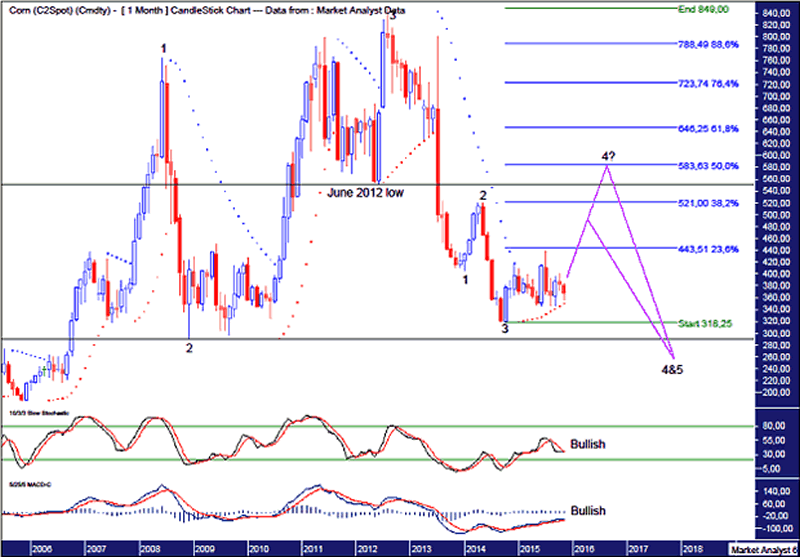
There is now change to this outlook which has been shown previously.
The PSAR indicator shows price finding solid support just above the dots which currently stand just above $350.
The Stochastic and MACD indicators are both bullish.
There loos to be a massive 5 point broadening top in play and the way I see it price is still making its way to an eventual point 4 low. This would need to be below the point 2 low which stands at $290 and is denoted by the lower horizontal line.
The current move into this final point 4 low now looks to be forming a 5 point broadening low formation - patterns within patterns. I favour a big bear rally now that will eventually terminate in a point 4 high. It is also possible for a lower high to form and I will certainly alert to that scenario.
The upper horizontal line denotes the June 2012 low and I favour this bear rally nudging that level which stands at $551.
Finally, I have added Fibonacci retracement levels of the move down from all time high to recent low and I am targeting the 50% level or thereabouts to see in the bear rally high. This level stands at $583.
Summing up, the corn price has been crackling for a while and now looks set to pop.
By Austin Galt
Austin Galt is The Voodoo Analyst. I have studied charts for over 20 years and am currently a private trader. Several years ago I worked as a licensed advisor with a well known Australian stock broker. While there was an abundance of fundamental analysts, there seemed to be a dearth of technical analysts. My aim here is to provide my view of technical analysis that is both intriguing and misunderstood by many. I like to refer to it as the black magic of stock market analysis.
Email - info@thevoodooanalyst.com
© 2015 Copyright The Voodoo Analyst - All Rights Reserved
Disclaimer: The above is a matter of opinion provided for general information purposes only and is not intended as investment advice. Information and analysis above are derived from sources and utilising methods believed to be reliable, but we cannot accept responsibility for any losses you may incur as a result of this analysis. Individuals should consult with their personal financial advisors.
Austin Galt Archive |
© 2005-2022 http://www.MarketOracle.co.uk - The Market Oracle is a FREE Daily Financial Markets Analysis & Forecasting online publication.