


Consumer Prices: A Sticky Situation
Economics / Inflation Dec 16, 2015 - 03:04 PM GMTBy: Gary_Tanashian

 We have noted anecdotally that there is a creeping inflation in the system. It does not show up in commodities, which are in a post-bubble (ah, the good old ‘China story’ that was so vigorously promoted to a degree that would make a gold bug promoter blush) melt down. Crashing costs like that are providing the Goldilocks-like balance to rising costs within the economy.
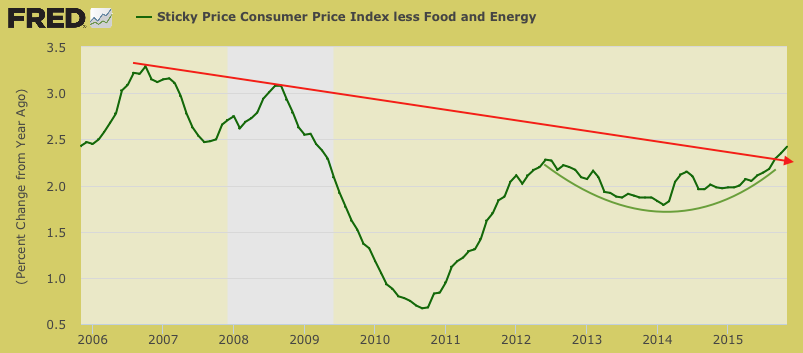
This morning, the highly recommended Daily Shot had among its macro graphs a look at the “sticky” consumer price index. That got me to go over to the St. Louis Fed website and pull a couple different views of it. First, here is SLF’s description of the sticky index…
“The Sticky Price Consumer Price Index (CPI) is calculated from a subset of goods and services included in the CPI that change price relatively infrequently. Because these goods and services change price relatively infrequently, they are thought to incorporate expectations about future inflation to a greater degree than prices that change on a more frequent basis. One possible explanation for sticky prices could be the costs firms incur when changing price.”
These could be considered the embedded costs within the economy, like the steady upward march in healthcare or my trash collector’s price increases due to administrative and regulatory issues built into this particular service (despite dropping fuel costs).
Is this one of the graphs the Fed is eyeing as it prepares to initiate a rate hike regimen? That’s a bullish looking breakout in sticky costs. How long can the commodity crash and associated Goldilocks be ridden? I think the Fed is rightly in anticipation mode.
Here’s the longer-term view…
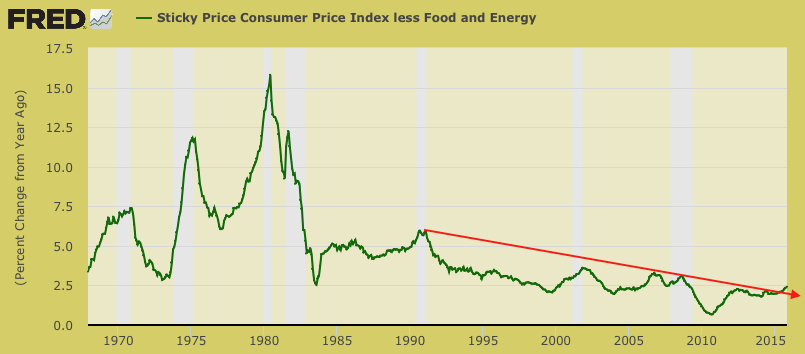
The meltdown in 2008/2009 dropped prices throughout the economy. Certain costs have been on an incline since then and these graphs show the potential for much higher levels. And then what if commodities actually bottom for a big bounce or cyclical rise? The Fed is right to be preemptive* about the possibilities of the inflation that they have tried so hard for years to promote.
Cue the roosting chickens.
* Sticking with the barnyard theme, one might argue that the horse is already out of the barn.
Subscribe to NFTRH Premium for your 25-35 page weekly report, interim updates (including Key ETF charts) and NFTRH+ chart and trade ideas or the free eLetter for an introduction to our work. Or simply keep up to date with plenty of public content at NFTRH.com and Biiwii.com.
By Gary Tanashian
© 2015 Copyright Gary Tanashian - All Rights Reserved
Disclaimer: The above is a matter of opinion provided for general information purposes only and is not intended as investment advice. Information and analysis above are derived from sources and utilising methods believed to be reliable, but we cannot accept responsibility for any losses you may incur as a result of this analysis. Individuals should consult with their personal financial advisors.
Gary Tanashian Archive |
© 2005-2022 http://www.MarketOracle.co.uk - The Market Oracle is a FREE Daily Financial Markets Analysis & Forecasting online publication.