


Crude Oil Price Breakdown!
Commodities / Crude Oil Jan 07, 2016 - 11:31 AM GMTBy: Nadia_Simmons

 Trading position (short-term; our opinion): Short positions (with a stop-loss order at $39.12 and an initial downside target at $33.66) are justified from the risk/reward perspective.
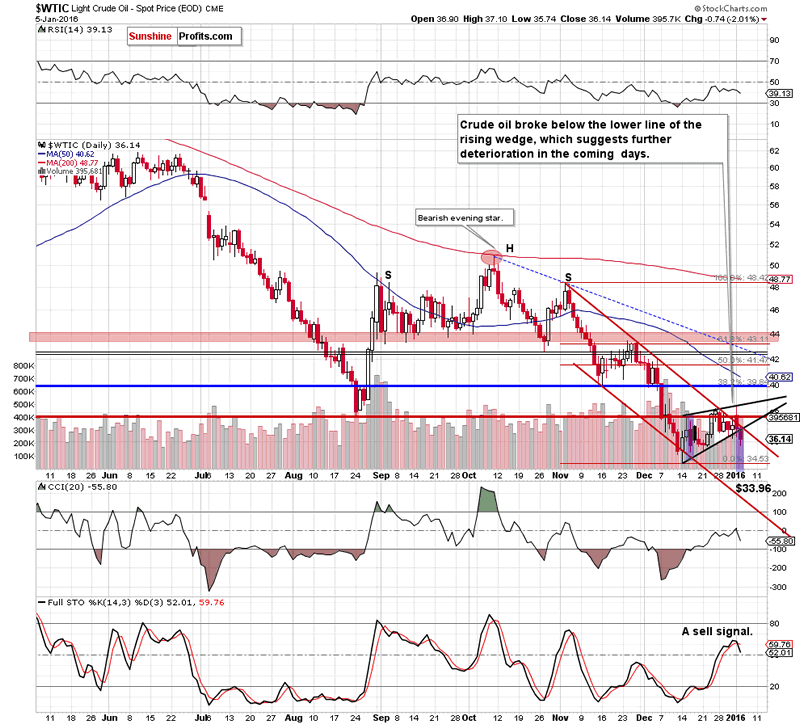
On Tuesday, crude oil lost 2.47% as a stronger greenback pushed the price lower. As a result, light crude extended losses and broke below important support line. What impact could it have on future moves?
Let's examine charts and find out (charts courtesy of http://stockcharts.com ).
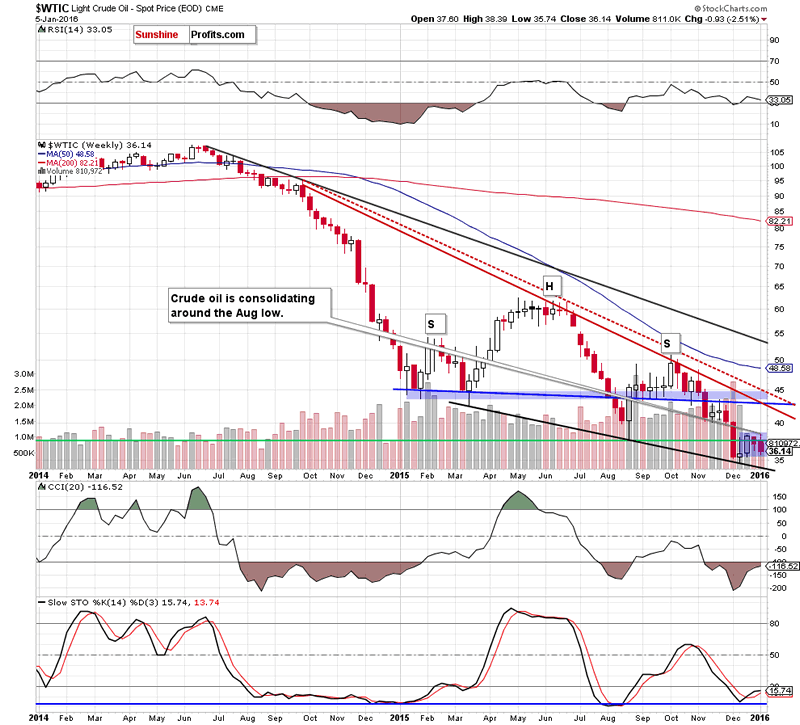
Looking at the weekly chart, we see that the situation in the medium term remains almost unchanged as the commodity is trading in a consolidation around the Aug low. Nevertheless, today's downswing approached light crude to the lower line of the formation, which could encourage oil bears to at in the coming days.
Can we infer something more from the very short-term picture? Let's examine the dily chart and find out.
Quoting our previous Oil Trading Alert:
(...) crude oil declined after another unsuccessful attempt to break above the resistance zone. As you see although crude oil increased after the market's open, the upper border of the rising wedge stopped oil bulls and triggered a pullback. With this downswing, the commodity invalidated earlier breakout above the upper border of the red declining trend channel, which is a negative signal that suggests further deterioration. On top of that, yesterday's drop materialized on sizable volume, which increases the probability of another downswing.
As you see on the daily chart oil bears pushed the commodity lower as we had expected. With Tuesday's downswing, light crude broke below the lower border of the rising wedge, which means that what we wrote on Dec 31 is up-to-date:
(...) if the black support line is broken, a way to $35.35 (and then to Dec low) will be open.
Nevertheless, yesterday's breakdown under the lower line of the formation suggests that we'll see a decline to around $33.96, where the size of the downward move will correspond to the height of the rising wedge. At this point, it is also worth noting that the Stochastic Oscillator generated a sell signal, which is an additional negative factor. Why? When we take a closer look at the daily chart, we see that all sell signals generated by the indicator since June encouraged oil bears to act and translated to bigger or smaller declines. Therefore, in our opinion, the history will repeat itself once again and we'll see lower values of the commodity in the coming days.
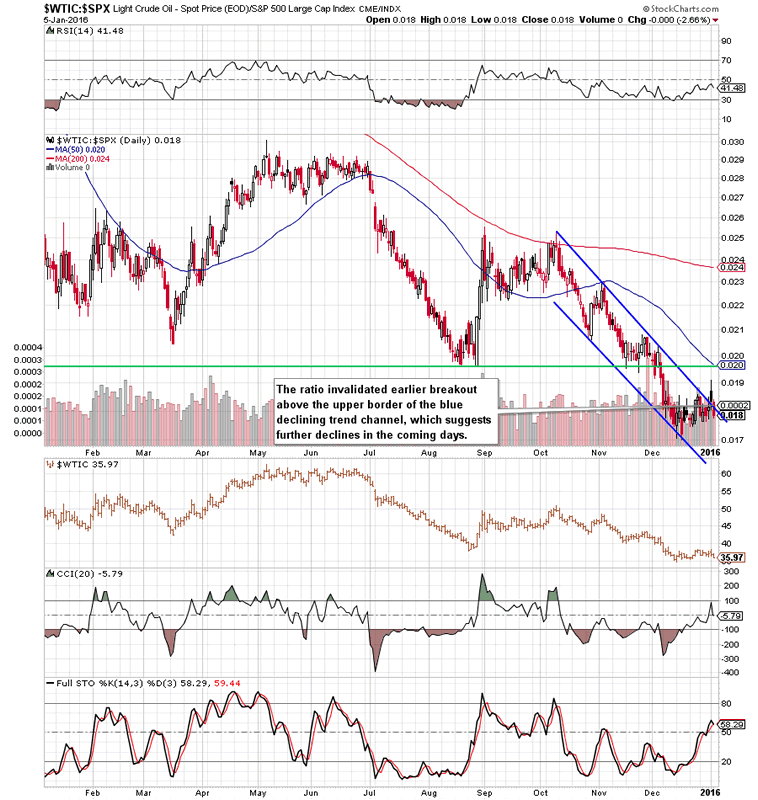
Finishing today's alert, we would like to draw your attention to one of our interesting ratios (more of them you'll find in our monthly Oil Investment Updates ), which shows the relationship between crude oil and the general stock market.
Looking at the above chart, we see that the ratio invalidated earlier breakout above the upper border of the blue declining trend channel, which is a negative signal that suggests further deterioration in the coming days. But what does it mean for the commodity? As you see on the chart, lower values of the ratio have corresponded to lower prices of light crude in previous months. Therefore, in our opinion, another downward move in the ratio will trigger further deterioration in crude oil in near future (especially when we factor in a sell signal generated by the Stochastic Oscillator).
Summing up, crude oil extended losses and broke below the lower border of the rising wedge, which suggests further deterioration and (at least) a test of the Dec low in the coming days. Therefore, short positions (with a stop-loss order at $39.12 and an initial downside target at $33.66) are justified from the risk/reward perspective.
Very short-term outlook: bearish
Short-term outlook: bearish
MT outlook: bearish
LT outlook: mixed with bearish bias
Trading position (short-term; our opinion): Short positions (with a stop-loss order at $39.12 and an initial downside target at $33.66) are justified from the risk/reward perspective.
Nadia Simmons
Forex & Oil Trading Strategist
Przemyslaw Radomski
Founder, Editor-in-chief
Sunshine Profits: Gold & Silver, Forex, Bitcoin, Crude Oil & Stocks
Stay updated: sign up for our free mailing list today
* * * * *
Disclaimer
All essays, research and information found above represent analyses and opinions of Nadia Simmons and Sunshine Profits' associates only. As such, it may prove wrong and be a subject to change without notice. Opinions and analyses were based on data available to authors of respective essays at the time of writing. Although the information provided above is based on careful research and sources that are believed to be accurate, Nadia Simmons and his associates do not guarantee the accuracy or thoroughness of the data or information reported. The opinions published above are neither an offer nor a recommendation to purchase or sell any securities. Nadia Simmons is not a Registered Securities Advisor. By reading Nadia Simmons’ reports you fully agree that he will not be held responsible or liable for any decisions you make regarding any information provided in these reports. Investing, trading and speculation in any financial markets may involve high risk of loss. Nadia Simmons, Sunshine Profits' employees and affiliates as well as members of their families may have a short or long position in any securities, including those mentioned in any of the reports or essays, and may make additional purchases and/or sales of those securities without notice.
© 2005-2022 http://www.MarketOracle.co.uk - The Market Oracle is a FREE Daily Financial Markets Analysis & Forecasting online publication.