


A Bottom in the Stock Market
Stock-Markets / Stock Markets 2016 Jan 12, 2016 - 04:45 PM GMTBy: Ed_Carlson

My December 15 commentary included a forecast for a high in equities near December 24. The eventual high which led to last week's big sell-off came two trading days late on December 29. In this week's commentary we turn our attention to forecasting a bottom to the current decline in equities.
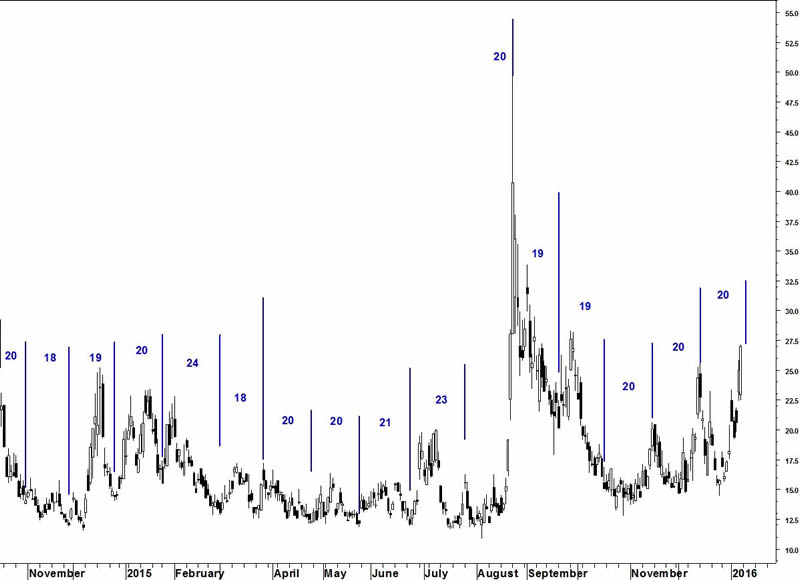
By combining the concept of Middle Sections (developed by the late technician George Lindsay) with my own, more traditional approach to cycles, I have developed a forecasting model I call the Hybrid Lindsay Model. It is used to forecast the calendar dates of highs and lows in the Dow Jones industrial index. It does not forecast price levels. The forecast for a low in the Dow this week is detailed below. While not part of the model, a happy coincidence is that the CBOE Volatility Index (VIX) has 20 trading-day cycle high due on January 12 (chart) giving that day (Tuesday) the highest probability for an end to the decline.
Middle Sections
A flattened top on 8/18/06 counts 1,719 days to the high of the previous Basic Cycle on 5/22/11. 1,719 days later is January 15.
Point C of a descending Middle Section on 9/25/14 counts 236 days to the high of the Multiple Cycle on 5/19/15. 237 days later is Monday, January 12.
Cycles
A micro-cycle low is due on 1/12/16. A monthly trading cycle low is due near 1/15/16. There are two other equally reliable trading cycles due Jan 22-25. We need to keep those in mind.
Don't forget the 34-week cycle which has done a phenomenal job marking highs during the bull market. It is due the week of Jan 18-22. I expect it will make an early showing this time.
Lindsay Intervals
107-day interval (102-112 days) counted from the low on 9/29/15 counts to a high in the period January 11-19.
A low-high-high count will exist if a top falls on 1/13/16 (which is 71 days after the high of Nov 3, which is 71 days after the low 8/24/15).
Get your copy of the January Lindsay Report at Seattle Technical Advisors.com
Ed Carlson, author of George Lindsay and the Art of Technical Analysis, and his new book, George Lindsay's An Aid to Timing is an independent trader, consultant, and Chartered Market Technician (CMT) based in Seattle. Carlson manages the website Seattle Technical Advisors.com, where he publishes daily and weekly commentary. He spent twenty years as a stockbroker and holds an M.B.A. from Wichita State University.
© 2015 Copyright Ed Carlson - All Rights Reserved
Disclaimer: The above is a matter of opinion provided for general information purposes only and is not intended as investment advice. Information and analysis above are derived from sources and utilising methods believed to be reliable, but we cannot accept responsibility for any losses you may incur as a result of this analysis. Individuals should consult with their personal financial advisors.
© 2005-2022 http://www.MarketOracle.co.uk - The Market Oracle is a FREE Daily Financial Markets Analysis & Forecasting online publication.