


The Dow/Silver Ratio Signals All-Time High Silver Prices
Commodities / Gold and Silver 2016 Jun 20, 2016 - 03:57 AM GMTBy: Hubert_Moolman

 I have written extensively about the relationship between the Dow and silver prices. One of the points I have emphasized, is the fact that Dow peaks are often followed by silver rallies.
Given the above, its natural that the Dow/Silver ratio is also an important indicator for future silver prices. One example of this, I deal with in my silver fractal analysis report:
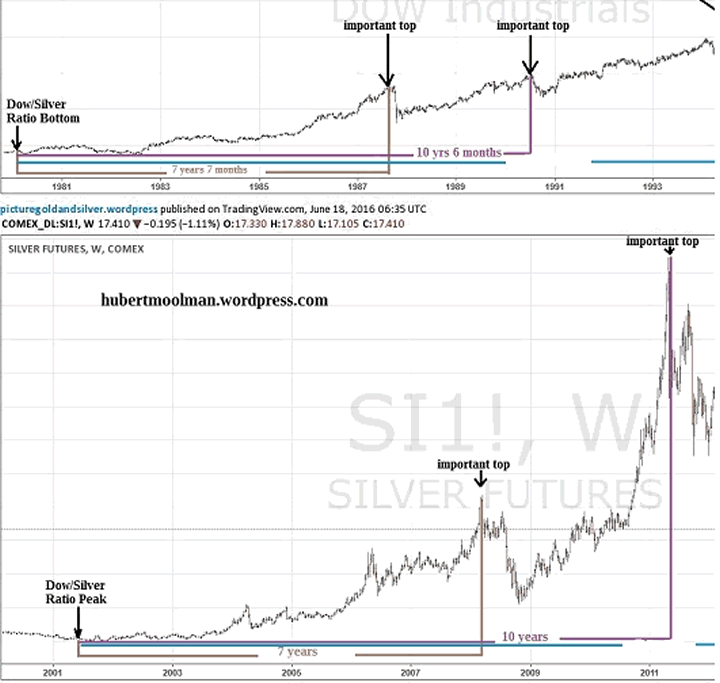
The top chart is the Dow (from 1980 to 1994), and the bottom is silver (from 2000 to 2012) - both charts are from tradingview.com.
In 1980, the Dow made a bottom, as measured in silver (Dow/Silver ratio bottom). For silver, a similar bottom would be when the Dow/Silver ratio peaked in 2001. For both charts, these points (respectively) were at significant lows (significant lows just before the start of the bull market).
The first important peak for the Dow, since the Dow/Silver ratio bottom came about after 7 years (and 7 months). For silver, the first important peak came about 7 years after the Dow/silver ratio peak.
The second important top for the Dow came about 10 years (and 6 months) after the Dow/silver ratio bottom. For silver, the second important top came about 10 years after the Dow/silver ratio peak.
This clearly shows that there is a measurable relationship between silver prices and the Dow, and that one can use the Dow/Silver ratio to help predict future silver prices. For example, this ratio will be very instrumental when formulating an exit strategy for silver.
Below, is a long-term chart of the Dow/Silver ratio (from tradingview.com):
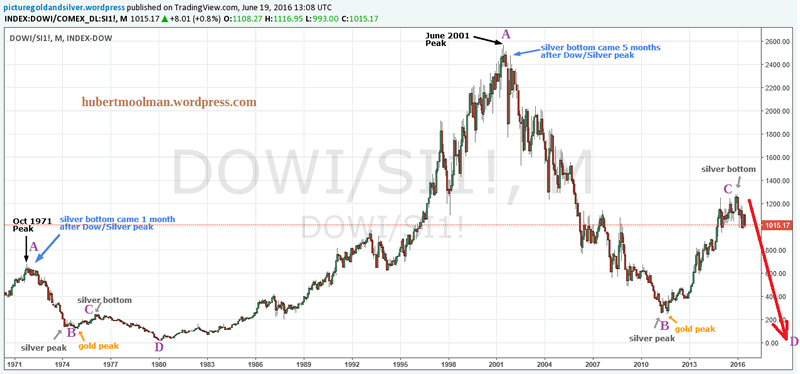
On the chart, I have indicated some key financial events. I have also marked two fractals (A to D). Both fractals or patterns, exist in a similar manner relative to the key events indicated.
Point A (of both patterns) is at the peak of the Dow/Silver ratio, just before the start of the silver bull market. In both cases, silver made a major bottom, soon after the Dow/Silver ratio peak.
Point B (of both patterns) is the bottom of the Dow/Silver ratio, just after a significant silver peak.
Point C (of both patterns) is the top of the Dow/Silver ratio, right at a significant silver bottom. On the 1970s pattern, point C was the low before we eventually had the rally that took silver to the then all-time high of $50.
If the comparison of the two patterns is justified, then we will have a similar rally (in the near future) that will take silver to a new all-time high. Furthermore, the top of the Dow/Silver ratio in 2001 is most likely a mega-top. Given that this is likely a mega-top; I would expect the Dow/Silver ratio to go lower than the 1980 low.
For more on this and this kind of fractal analysis, you are welcome to subscribe to my premium service. I have also recently completed a Silver Fractal Analysis Report as well as a Gold Fractal Analysis Report
Warm regards
Hubert
“And it shall come to pass, that whosoever shall call on the name of the Lord shall be saved”
http://hubertmoolman.wordpress.com/
You can email any comments to hubert@hgmandassociates.co.za
© 2016 Copyright Hubert Moolman - All Rights Reserved
Disclaimer: The above is a matter of opinion provided for general information purposes only and is not intended as investment advice. Information and analysis above are derived from sources and utilising methods believed to be reliable, but we cannot accept responsibility for any losses you may incur as a result of this analysis. Individuals should consult with their personal financial advisors.
© 2005-2022 http://www.MarketOracle.co.uk - The Market Oracle is a FREE Daily Financial Markets Analysis & Forecasting online publication.