


Crude Oil - Precious Metals Link
Commodities / Crude Oil Jul 12, 2016 - 03:08 PM GMTBy: Nadia_Simmons

 In the recent few weeks oil bulls and bears fought battles between the barrier of $50 (the key resistance) and the green support zone based on the Apr and early May highs. After several unsuccessful attempts to move higher oil bears took control and crude oil closed Thursday's and Friday's sessions under its first important support zone. How did this drop affect the oil-to gold and oil-to-silver ratios? Let's jump right into charts (chart courtesy of http://stockcharts.com) and find out.
Let's start today's article with the very short-term chart of oil-to-gold ratio.
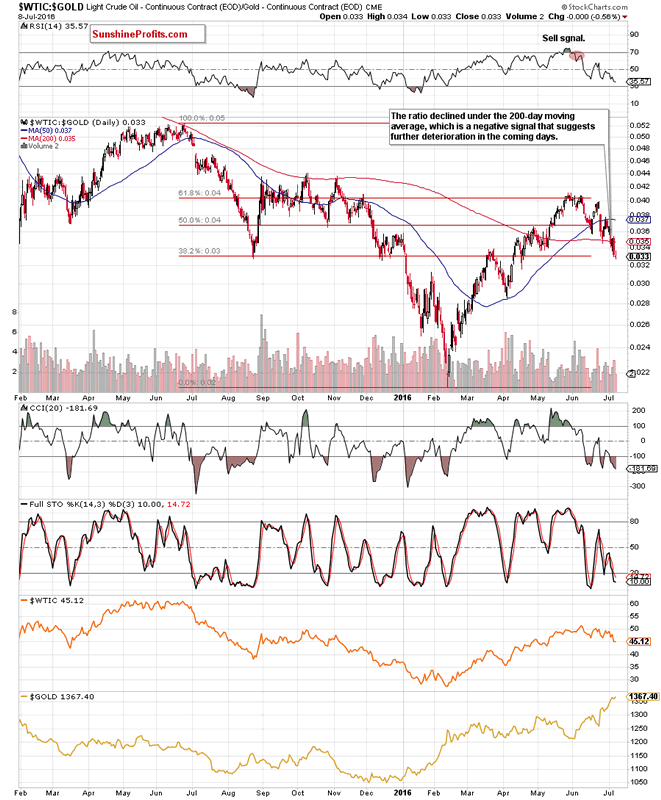
On the daily chart, we see that the ratio extended losses in recent days, which resulted in a drop under the 200-day moving average. Additionally, the ratio closed Thursday's session below it, which is an additional bearish signal. On top of that, a sell signal generated by the Stochastic Oscillator remains in play, supporting further deterioration in the coming days.
What impact did this move have on the weekly chart? Let's check.
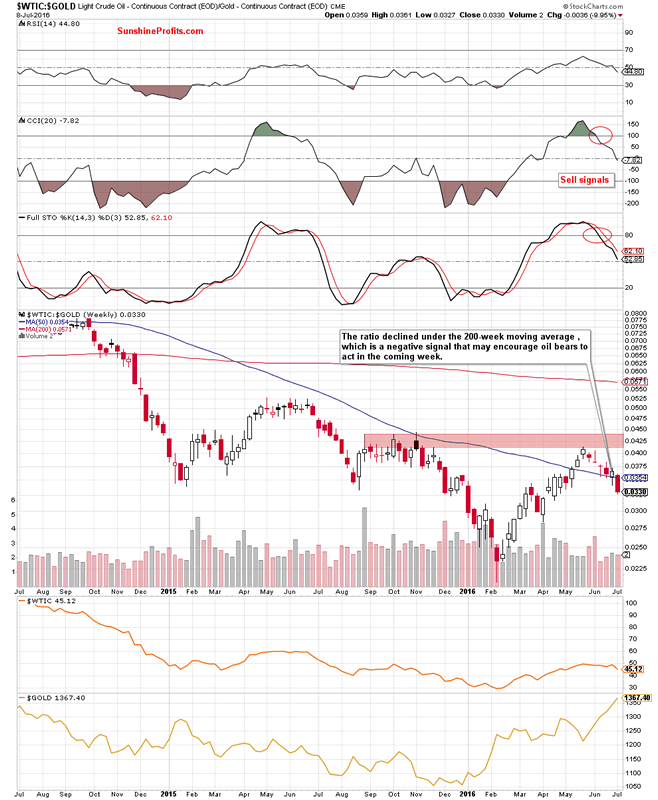
From this perspective, we see that the ratio declined under the 50-week moving average and closed the previous week below it, which in combination with sell signals generated by the CCI and Stochastic Oscillator is another pro bearish factor that suggests further deterioration in the ratio. What impact such price action could have on crude oil? Similarly to what we wrote in the case of the oil-to-oil stocks ratio, there is a strong positive correlation between the above ratio and the price of crude oil. Therefore, another downswing in the ratio will correspond to another drop in the commodity.
Having said the above, let's zoom out our picture and examine the long-term chart of the above ratio.
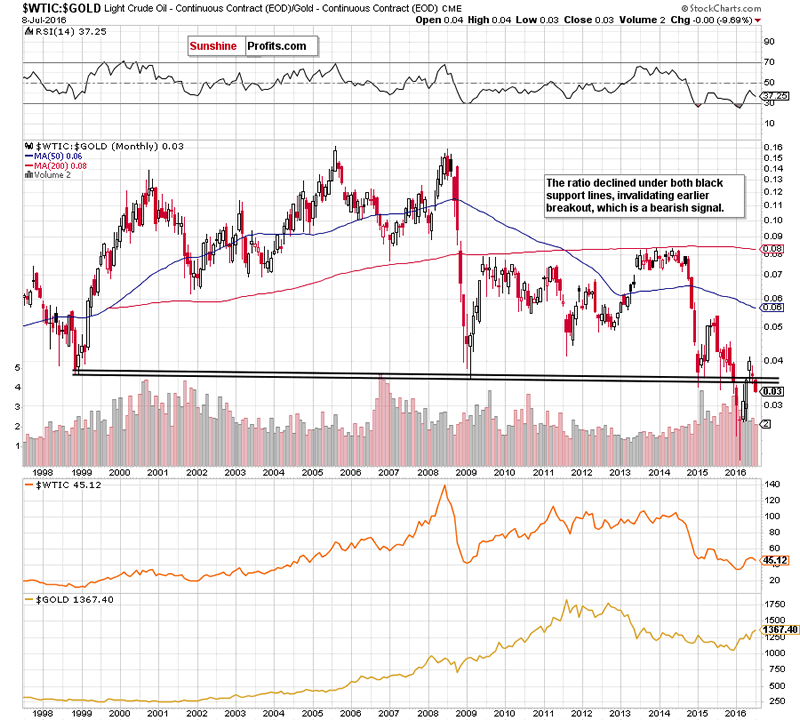
From the monthly perspective, we see that the ratio declined under both black support lines, invalidating earlier breakout, which is a bearish signal that suggests further declines (in the ratio and in crude oil) in the coming days/weeks.
Once we know the above, let's check what we can infer from the oil-to-silver ratio.
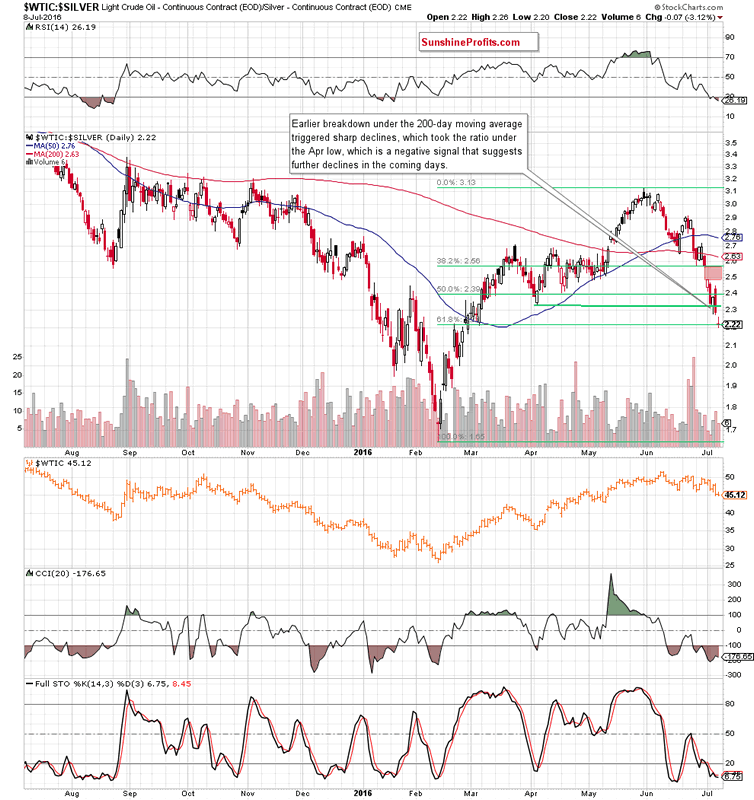
Looking at the daily chart, we see that the breakdown under the 200-day moving average accelerated declines, which resulted in a bearish gap (marked with red) and further deterioration in recent days. Thanks to yesterday's drop the ratio declined under the Apr low and closed the day below it, which is a negative signal that suggests (at least) a test of the 61.8% Fibonacci retracement based on the entire Feb-Jun upward move. If this is the case, and we see such price action, lower values of the ratio will translate into lower prices of crude oil - similarly to what we saw many times in the past.
Will we find more negative signals on the weekly chart? Let's check.
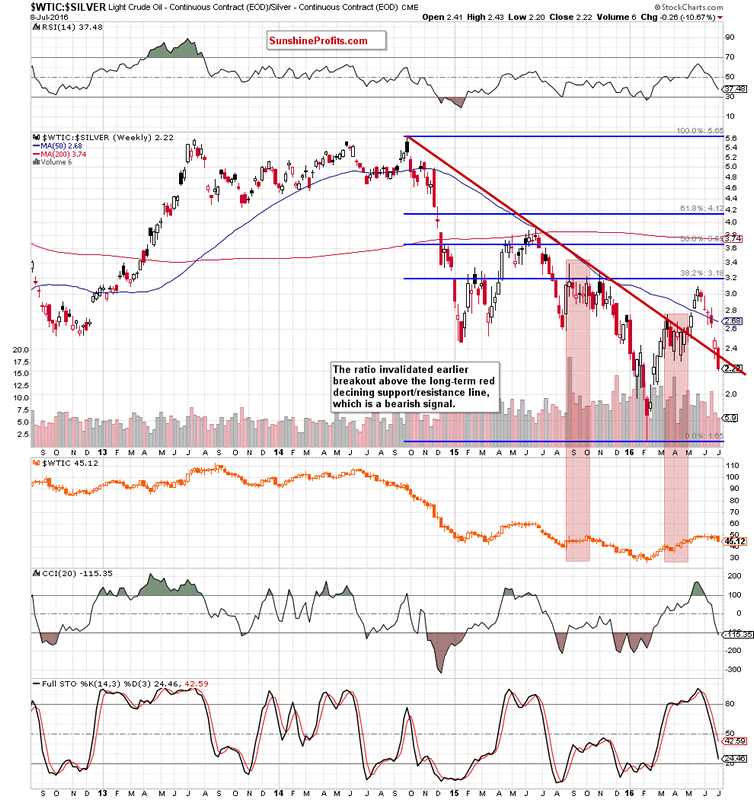
The first thing that catches the eye on the above chart is breakdown under the previously-broken long-term red declining line. Thanks to this drop, the ratio invalidated earlier breakout above this important line, which is a strong bearish event. Additionally, sell signals generated by the indicators are still in play, supporting further declines in ratio and also in crude oil in the coming week(s).
Having said the above, let's take a look at the same chart from the long-term perspective.
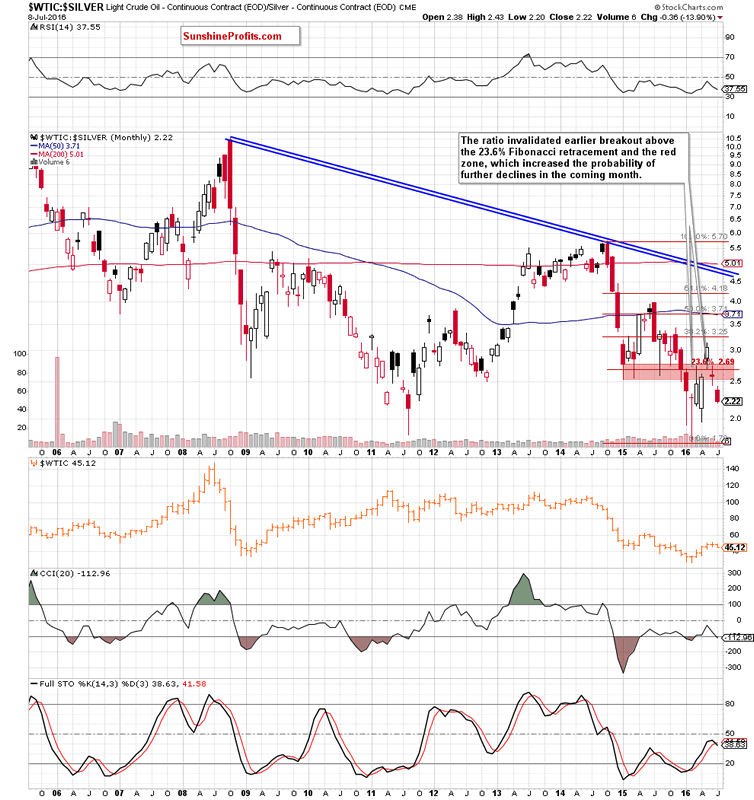
On the monthly chart, we see that the ratio invalidated earlier breakout above the 23.6% Fibonacci retracement (based on the entire 2014-2016 downward move) and the red zone, which means that oil bears have another negative signal, which could encourage them to push crude oil lower in the coming week(s).
Summing up, the oil-to-gold and oil-to-silver ratios declined in the previous week, invaidating earlier breakouts above important supports, which suggests further declines and doesn't bode well for crude oil as lower values of both ratios have translated into lower prices of light crude many times in the past. Taking the above into account and combining it with sell signals generated by the indicators, we think that further deterioraion in crude oil is just around the corner.
Nadia Simmons
Forex & Oil Trading Strategist
Przemyslaw Radomski
Founder, Editor-in-chief
Sunshine Profits: Gold & Silver, Forex, Bitcoin, Crude Oil & Stocks
Stay updated: sign up for our free mailing list today
* * * * *
Disclaimer
All essays, research and information found above represent analyses and opinions of Nadia Simmons and Sunshine Profits' associates only. As such, it may prove wrong and be a subject to change without notice. Opinions and analyses were based on data available to authors of respective essays at the time of writing. Although the information provided above is based on careful research and sources that are believed to be accurate, Nadia Simmons and his associates do not guarantee the accuracy or thoroughness of the data or information reported. The opinions published above are neither an offer nor a recommendation to purchase or sell any securities. Nadia Simmons is not a Registered Securities Advisor. By reading Nadia Simmons’ reports you fully agree that he will not be held responsible or liable for any decisions you make regarding any information provided in these reports. Investing, trading and speculation in any financial markets may involve high risk of loss. Nadia Simmons, Sunshine Profits' employees and affiliates as well as members of their families may have a short or long position in any securities, including those mentioned in any of the reports or essays, and may make additional purchases and/or sales of those securities without notice.
© 2005-2022 http://www.MarketOracle.co.uk - The Market Oracle is a FREE Daily Financial Markets Analysis & Forecasting online publication.