


New Stocks Bull Market?
Stock-Markets / Stock Markets 2016 Aug 14, 2016 - 12:13 PM GMTBy: Tony_Caldaro

 The week started with the SPX at 2183. On Monday the SPX made a slightly higher high, hit an all time high at 2188 on Tuesday, then pulled back to 2172 on Wednesday. On Thursday the SPX matched that high, then dipped some to end the week at 2184. Overall it was a quiet week with a range of less than 1%. For the week the SPX/DOW were +0.15%, and the NDX/NAZ were +0.25%. Economic reports for the week were mostly positive. On the downtick: the PPI and the Q3 GDP estimate. On the uptick: business/wholesale inventories, export/import prices, consumer sentiment, plus the budget deficit and weekly jobless claims both improved. Next week’s economic reports will be highlighted by the FOMC minutes, Industrial production and Housing.
LONG TERM: uptrend
In the world of Elliott Wave analysis we are always dealing with probabilities. Most times there is just one significant count that fits the probabilities. And at others, there could be several. When there are several potential counts it is generally not a problem for investors, as long as they are all pointing in the same market direction. Which is the situation now. Over time the market will eliminate some of the counts, until we are again dealing with just one count.
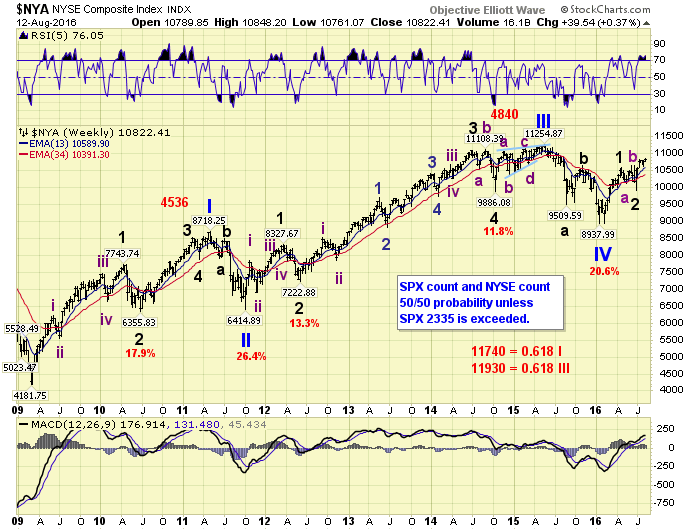
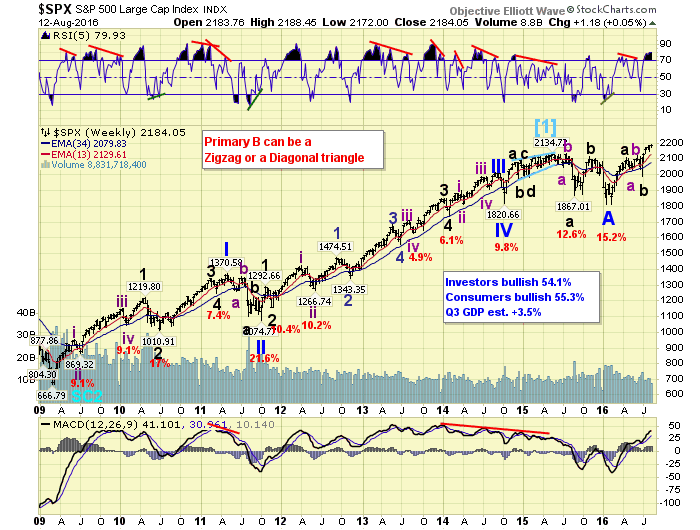
In recent months we have been presenting two scenarios: Primary V in the NYSE, and Primary B in the SPX. Despite giving these counts a 50/50 probability they can actually occur at the same time. As the NYSE only requires new all time highs for a Primary V. However, the upside would be limited to about SPX 2335: 1.618 x Primary A. Nevertheless both suggest a positive outcome in the weeks and months ahead.
Another quantified count, which also offers a positive outcome, has been posted for a few weeks in Stockcharts on the DOW charts. This count has been mentioned but no details have been given until this time. After completing the necessary research we now feel it is time to formally present it. Keep in mind all long/medium term waves have to be quantified to even be presented as a viable possibility. We can not just place labels on a chart because an index has a certain look and the labels look right. We can only place labels where quantified waves have actually occurred. This is the main reason we have not adopted the NYSE count on the SPX charts. The two wave patterns may look alike, but they are not the same.
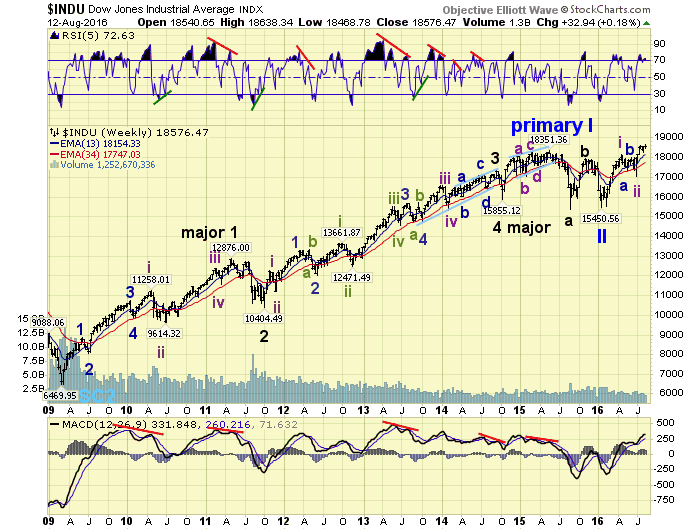
From 2009 to 2015 OEW quantified a long term uptrend. Then at the beginning of 2016 OEW confirmed a long term downtrend. An impulsive long term uptrend defines a bull market. Everything else is a bear market, or bear market rally. What was surprising was that within a month after the long term downtrend was confirmed the market reversed, and is now again in a long term uptrend. This is a relatively rare event, and has occurred less then 20% of the time in the entire 130-year history of the US stock market. Thus far the uptrend looks impulsive suggesting a new bull market is underway. Not a continuation of the 2009 bull market.
Since the bear market only corrected about 15% it does not qualify as a Cycle wave. Therefore if a new bull market is underway, 2009-2016 can only be labeled as Primary waves I and II. This suggests a Primary III bull market is now underway as Cycle wave [1] extends in time, from the expected somewhat short pattern to a much, much longer pattern. Certainly, by now, some of you are probably thinking the fundamentals do not support such a scenario. Just think back to August 2009. Did the fundamentals then support a 6-year bull market that would triple from the SPX 667 low?
One thing we uncovered while doing this research is that the NYSE, which does have four completed quantified waves and currently in its fifth, is actually more representative of a foreign index than a US index. NYSE index a foreign index? While the NYSE composite contains mostly US companies there is a handful of very large cap ADR’s. These ADRs have apparently skewed the index enough to make it look more like the DJ World index than a US index. Nearly all of the foreign markets also display four quantified waves during 2009-2016, with possibly a fifth underway. As a result the count that most Elliotticians have embraced is actually a world index count, and not a US index count.
For now, since all three of these potential scenarios point to higher prices ahead, we will just let the stock market eliminate the two that do not apply as it continues to unfold.
MEDIUM TERM: uptrend
Regardless of the actual labeling, an uptrend began at the Br-exit low in late June at SPX 1992. Thus far we have counted five waves up from that low with the fifth wave still underway. The four completed waves were at SPX: 2109-2074-2178-2148, and the fifth wave has already made new highs.
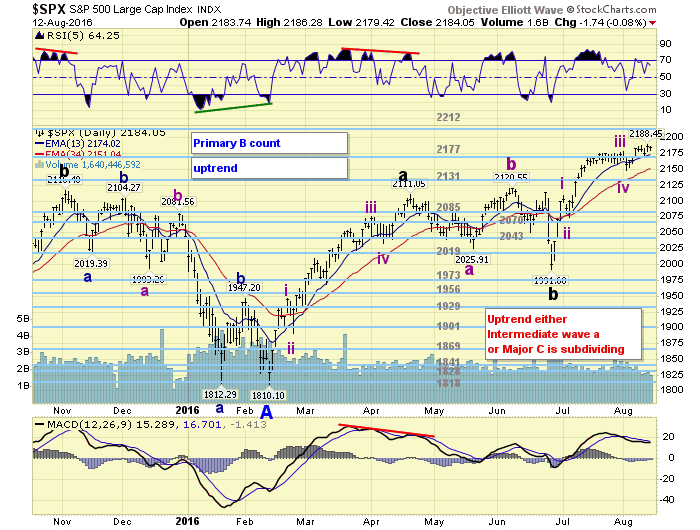
The important thing about this count is that the third wave (104 pts.) was shorter than the first wave (117 pts.). This requires the current fifth wave to be shorter than both, since the third wave cannot be the shortest. This suggests the upside limit to this uptrend is SPX 2251. The uptrend hit SPX 2188 this week.
This also offers another interesting problem as noted by the red box on the SPX and NYSE daily charts. We covered this in detail in last weekend’s update. Quite a few variables to deal with in the months ahead. Medium term support is at the 2177 and 2131 pivots, with resistance at the 2212 and 2252 pivots.
SHORT TERM
As previously noted this uptrend has unfolded in four completed waves with the fifth underway. Since the fifth wave has to be the shortest of the three, we had calculated three Fibonacci levels where it could possibly conclude: 2200, 2221 and 2230. These are all 2 points. There is also two OEW pivots at 2212 and 2252. These are 7 points.
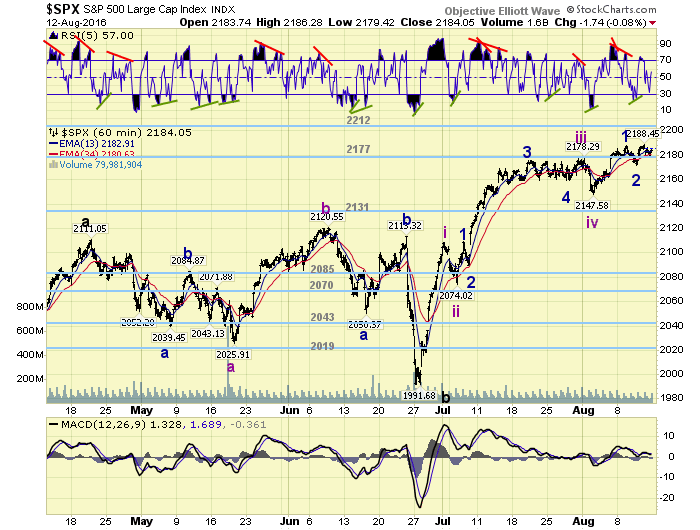
During this fifth wave up from SPX 2148 we have observed two smaller waves, with a third underway: 2188-2172-and 2188 again thus far. Since the first wave travelled 40 points, then pulled back 16 points, the third wave could also rally 40 points to the 2212 pivot. Then after another 15-20 point pullback the SPX should rally again to complete the fifth of fifth wave. This is one possibility. Regardless of how it unfolds the SPX should not drop to 2148 again until these five smaller waves conclude. If it does the uptrend is probably already over, and 5+% correction is probably underway. Short term support is at the 2177 and 2131 pivots, with resistance at the 2212 and 2252 pivots. Short term momentum ended the week just above neutral. Best to your trading next week!
FOREIGN MARKETS
The Asian markets were mostly higher on the week for a net gain of 1.5%.
The European markets were all higher for a gain of 2.2%.
The Commodity equity group were also all higher for a gain of 2.2%.
The DJ World index gained 1.2%.
COMMODITIES
Bonds are in a downtrend but gained 0.3% on the week.
Crude appears to be in an uptrend and gained 6.4% on the week.
Gold is also in an uptrend and gained 0.1% on the week.
The USD is in a downtrend and lost 0.5% on the week.
NEXT WEEK
Monday: the NY FED at 8:30 then the NAHB at 10am. Tuesday: building permits, the CPI, housing starts and industrial production. Wednesday: the FOMC minutes. Thursday: weekly jobless claims, the Philly FED and leading indicators. Friday: Options expiration.
CHARTS: http://stockcharts.com/public/1269446/tenpp
After about 40 years of investing in the markets one learns that the markets are constantly changing, not only in price, but in what drives the markets. In the 1960s, the Nifty Fifty were the leaders of the stock market. In the 1970s, stock selection using Technical Analysis was important, as the market stayed with a trading range for the entire decade. In the 1980s, the market finally broke out of it doldrums, as the DOW broke through 1100 in 1982, and launched the greatest bull market on record.
Sharing is an important aspect of a life. Over 100 people have joined our group, from all walks of life, covering twenty three countries across the globe. It's been the most fun I have ever had in the market. Sharing uncommon knowledge, with investors. In hope of aiding them in finding their financial independence.
Copyright © 2016 Tony Caldaro - All Rights Reserved Disclaimer: The above is a matter of opinion provided for general information purposes only and is not intended as investment advice. Information and analysis above are derived from sources and utilising methods believed to be reliable, but we cannot accept responsibility for any losses you may incur as a result of this analysis. Individuals should consult with their personal financial advisors.
Tony Caldaro Archive |
© 2005-2022 http://www.MarketOracle.co.uk - The Market Oracle is a FREE Daily Financial Markets Analysis & Forecasting online publication.