


End of SPX Stock Market Correction Nears
Stock-Markets / Stock Markets 2016 Oct 08, 2016 - 04:48 PM GMTBy: Tony_Caldaro

 The market started the week at SPX 2168. After a gap down opening on Monday the market declined to SPX 2144 by Tuesday. A gap up opening on Wednesday carried the market to SPX 2164. Then a pullback on Thursday to SPX 2150 was followed by a rally into Friday to SPX 2166. Then the market pulled back to SPX 2145, only to end the week at SPX 2154. For the week the SPX/DOW lost 0.35%, and the NDX/NAZ lost 0.30%. Economic reports for the week were again mixed. On the downtick: construction spending, wholesale inventories, the Q3 GDP estimate, the ADP, plus the trade deficit and unemployment rate rose. On the uptick: ISM manufacturing/services, auto sales, factory orders, monthly payrolls, consumer credit, plus weekly jobless claims declined. Next week’s reports will be highlighted by the FOMC minutes, the PPI and Retail sales. Best to your week!
LONG TERM: uptrend
While the SPX has remained in a narrow 2119-2194 trading range for about three months, we are seeing some positive trending markets overseas. One in Europe and one emerging market. When we throw the NDX/NAZ into the mix we believe these markets and indices are suggesting future economic and earnings growth ahead. This might be the reason the SPX has not had a meaningful correction since the 2194 all time high. To date, after about two months, it has only dropped about 3.5%. The smallest percentage correction since 2006.
The positive trending European market is the FTSE. It has recently confirmed five waves up from the February 2016 low, and nearly made a new all time high this week. The emerging market index is the NIFTY. The NIFTY has risen, in one single wave, from the February lows to within 1.5% of its all time high. The NDX/NAZ have both risen in five waves up from their February lows and have made all time new highs already. This is bull market activity!
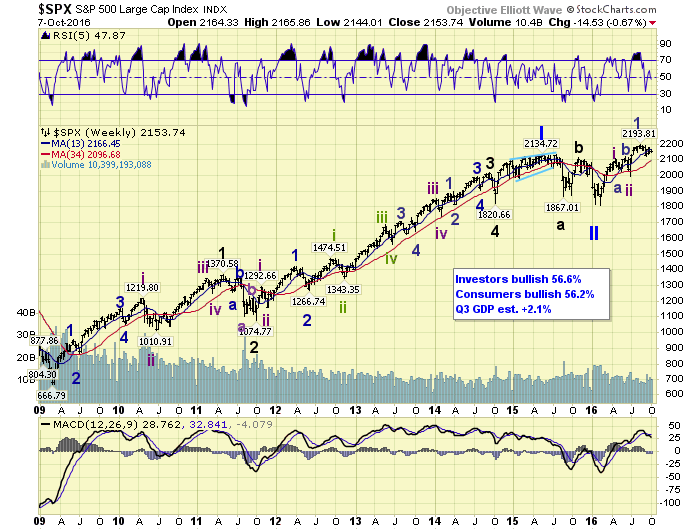
In the meantime the SPX has risen in three waves from its February lows, keeping the numerous bearish scenarios alive. We labeled the first uptrend Intermediate wave i at SPX 2111. Then after an irregular Intermediate wave ii correction to SPX 1992, we labeled the next uptrend Minor wave 1 of Int. iii to SPX 2194. A Minor wave 2 correction continues to appear to be underway. When it concludes the SPX should kick off into Minor wave 3 of Intermediate wave iii. Potentially the point of recognition for this bull market.
MEDIUM TERM: downtrend
The current downtrend began about two months ago off the SPX 2194 all time high. Since then the market has been quite choppy while remaining in a narrow 75 point range. It appears the market has been marking time, rather than marking down price during this correction. Thus far the daily/weekly RSI’s have reset to levels similar to the previous correction. And the daily/weekly MACD’s have reset and turned slightly higher without any impulsive activity. This suggests the SPX may need to retest those lows with a possible positive divergence to get the bulls excited again.
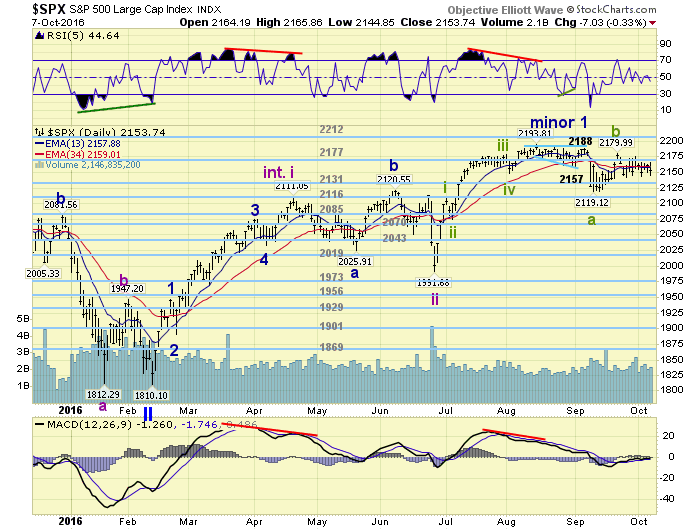
The initial decline from SPX 2194 can be counted in two ways. Either an expanding diagonal fifth wave, or a contracting diagonal ‘a’ wave. Either way works at this point, since the market has had a multitude of waves during the past two months in a seemingly random pattern. Nevertheless, as will be explained below, we think a retest of the OEW 2116 pivot range is the most probable outcome before this market starts impulsing again. Medium term support remains at the 2131 and 2116 pivots, with resistance at the 2177 and 2212 pivots.
SHORT TERM
While this downtrend has been great for day traders it has been just the opposite for investors. There have been a multitude of waves keeping both the bulls and the bears hopes alive. If one filters out some of the noise created by all these waves, and just focus on the larger swings we see a pattern.
We have labeled the first decline, from SPX 2194, as a three wave Minute A: 2157-2188-2119. Then we labeled a choppy rally to SPX 2180 as Minute B. And now Minute C should be underway from that high, and we have three waves down with the third still in progress: 2142-2175-2144 thus far. On the surface this information is fairly obvious, and has little meaning until one actually measures the waves.
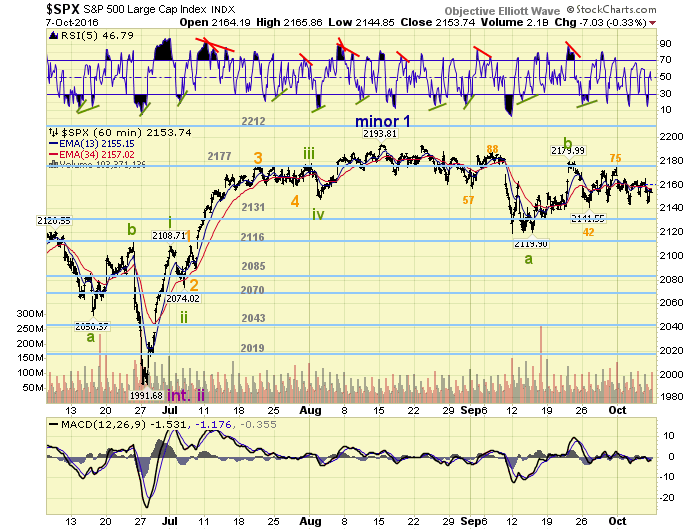
The length of Minute A’s three waves were: 37-31-69 points. The length of Minute C’s three waves are: 38-33-31(thus far). See the pattern? The first and second waves of each decline were nearly identical. This suggests the third wave may be nearly identical as well. If it is, the market should find support just above SPX 2100 in the coming week or so. If a little shorter, then the OEW 2116 pivot range should provide support again for the end of the correction. We may also add that the third wave down of Minute C is also three waves. And, if this third wave is 1.618 times the first support is at SPX 2116. If twice the first wave support is at SPX 2104. Within all the noise there is actually a pattern.
Short term support is at SPX 2142/45 and the 2131 pivot, with resistance at SPX 2162/65 and the 2177 pivot. Short term momentum ended the week right at neutral.
FOREIGN MARKETS
Asian markets were mostly higher for a net gain of 0.8%.
European markets were quite mixed for a net gain of 0.2%.
The Commodity equity group were mostly higher for a net gain of 1.6%.
The DJ World index lost 0.6%.
COMMODITIES
Bonds continue to downtrend and lost 0.8% on the week.
Crude confirmed its uptrend and gained 3.3% on the week.
Gold continues its downtrend and lost 5.0% on the week.
The USD continued its uptrend and gained 1.2% on the week.
NEXT WEEK
Wednesday: the FOMC minutes. Thursday: weekly jobless claims, export/import prices, and the treasury deficit. Friday: the PPI, retail sales, business inventories, consumer sentiment, and a speech from FED chair Yellen. Best to your weekend and week!
CHARTS: http://stockcharts.com/public/1269446/tenpp
After about 40 years of investing in the markets one learns that the markets are constantly changing, not only in price, but in what drives the markets. In the 1960s, the Nifty Fifty were the leaders of the stock market. In the 1970s, stock selection using Technical Analysis was important, as the market stayed with a trading range for the entire decade. In the 1980s, the market finally broke out of it doldrums, as the DOW broke through 1100 in 1982, and launched the greatest bull market on record.
Sharing is an important aspect of a life. Over 100 people have joined our group, from all walks of life, covering twenty three countries across the globe. It's been the most fun I have ever had in the market. Sharing uncommon knowledge, with investors. In hope of aiding them in finding their financial independence.
Copyright © 2016 Tony Caldaro - All Rights Reserved Disclaimer: The above is a matter of opinion provided for general information purposes only and is not intended as investment advice. Information and analysis above are derived from sources and utilising methods believed to be reliable, but we cannot accept responsibility for any losses you may incur as a result of this analysis. Individuals should consult with their personal financial advisors.
Tony Caldaro Archive |
© 2005-2022 http://www.MarketOracle.co.uk - The Market Oracle is a FREE Daily Financial Markets Analysis & Forecasting online publication.