


An Elusive Stock Market Top
Stock-Markets / Stock Markets 2016 Nov 28, 2016 - 09:57 AM GMTBy: Andre_Gratian

 Current Position of the Market
SPX Long-term trend: If the market strength persists, the long-term trend may need to be re-evaluated.
SPX Intermediate trend: SPX intermediate count to 2240 may turn out to only be a minimum projection.
Analysis of the short-term trend is done on a daily-basis with the help of hourly charts. It is an important adjunct to the analysis of daily and weekly charts which discuss longer market trends.
AN ELUSIVE TOP
Market Overview
A week ago, SPX had reached a minor projection at 2190 which, by the technical look of things and the hourly divergences, could have created a short-term top. It did, with the emphasis on “short” since the correction lasted only one day. Another minor projection between 2200-2204 came and went with the index finally closing at 2213 on Friday. This market has been making fools of those who harbor even a tinge of bearishness, so I am being very daring by saying that Friday's close has again a chance of producing a short-term top at about this level. First, it looks as if we have filled the count taken on the right side of the P&F fulcrum pattern which was created during the consolidation taking place between 2150 and 2170; incidentally, 2112 also happens to be a pivot point! Secondly, the 13-day cycle could still produce a minor low on Monday or Tuesday, or it may have inverted and could be making a high instead of a low. Finally, all the divergences are still there, and let's keep in mind that mid-December should bring an interest hike by the Fed, but until some weakness appears, the market bunny could continue to beat its drum!
The upward momentum being displayed by the major indices since the climactic low of the 9th (which was visible only in futures) is leading me to also be cautious about calling for an intermediate top at 2240 -- which I would now have to consider as the minimum -- with a good possibility of reaching another fifty points or so before finding either an intermediate top, or the end of the bull market. But for now, we want to concentrate on the possibility of a short-term pull-back starting early next week.
Analysis
Daily chart
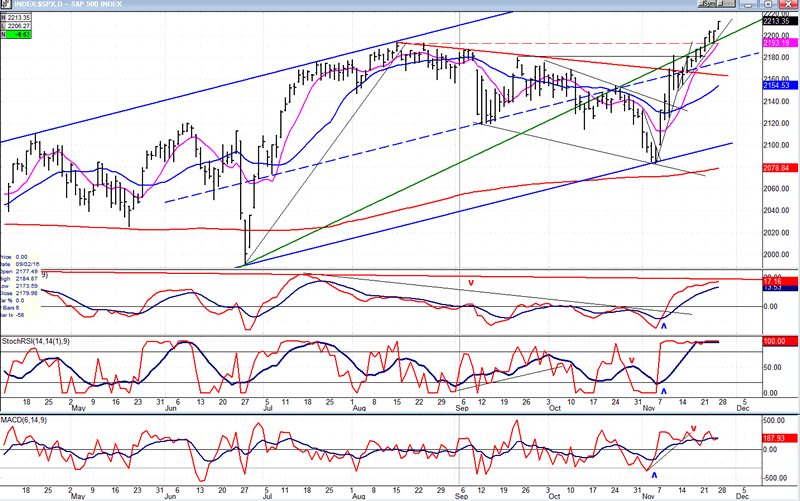
SPX is traveling in a broad (blue) channel formed by three points of contact at the top and two at the bottom, which give it legitimacy. The advance briefly stopped at 2182 and crawled under the intermediate trend line from 1810, finally rising above it after overcoming the former all-time high of 2195. Even a minor correction could bring the index below it once again and re-activate its role as a resistance line.
There is no weakness showing in the first stage of the advance from 2084, but after the rally resumed, the price action became more measured, although steady, with no more than a two-day consolidation. Nevertheless, breadth has been lagging, suggesting that this is not a broad-based, but rather a selective advance. Considering the factors discussed in the Market Overview, the rally could give way to a minor consolidation at any time, especially if the 6-week cycle (which is due to bottom in early December) can develop some downside traction into its low.
As for the oscillators, the SRSI has been overbought for over a week, but it will require some price pull-back to turn down. The MACD also displays the deceleration taking place in the price pattern. But the A/D oscillator is clearly the weakest. It never achieved the momentum established by the price oscillators and appears to be looking for an opportunity to turn down and give a sell signal. It could succeed as early as next week.
This chart and others below, are courtesy of QCharts.com.
Hourly chart
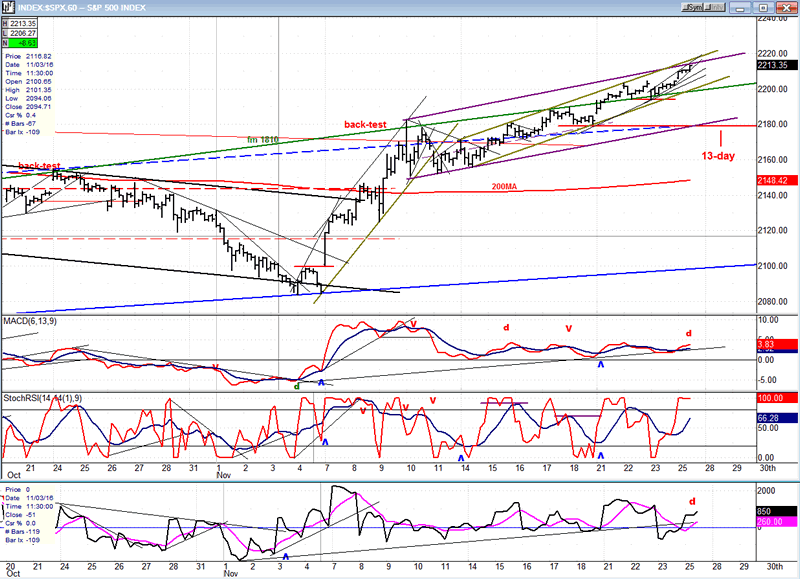
You must admit that this is a strange looking chart. The original thrust was very sharp, but for the past three weeks, prices have been crawling upward, reflecting a loss of momentum, but being unable to correct for more than a few hours. On Friday, a day which could have been distorted by low participation due to the early close, prices ended up at the top of two channels, as they filled a count taken at the 2150 accumulation level. The 13-day cycle, which could be the cause of the decelerating price pattern, is shown on the chart to bottom ideally on Tuesday, but it often varies by two days. The larger 6-wk cycle, due in the early days of December, should have a better chance of bringing about a consolidation.
For a correction to take place, we will first need to break below the lower green channel line. If the consolidation is deep enough, we could find support on the larger purple channel line which is being reinforced by the mid-channel line of the primary blue channel. 2177 is also a pivot point, and this should add to support. If we break below this level, it could extend the decline all the way down to the 2130 level (another pivot point).
The A/D oscillator has remained essentially neutral, for the most part failing to rise significantly into positive territory. The MACD has done pretty much the same thing, showing a lack of acceleration and a consistent pattern of negative divergence with price over the past two weeks.
An overview of some major indexes (Weekly charts)
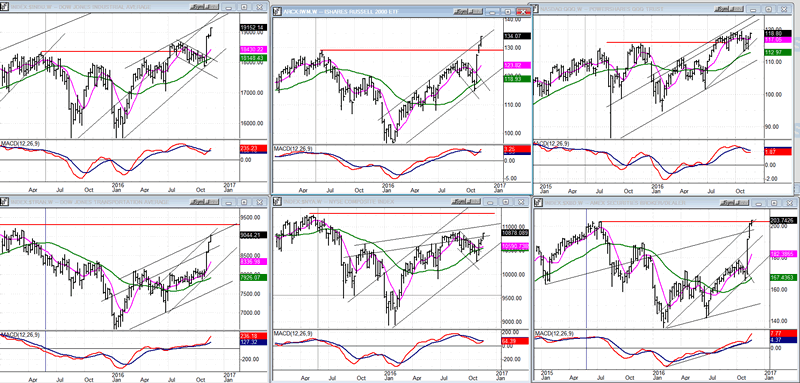
Last week, all indexes made new highs, with XBD (bottom right) making a fractional new bull market high, while QQQ (top right) remained below its recent top. Only NYA and TRAN are still trading below their all-time highs. Except for a slight tinge of deceleration, there is no visible weakness.
UUP (dollar ETF)
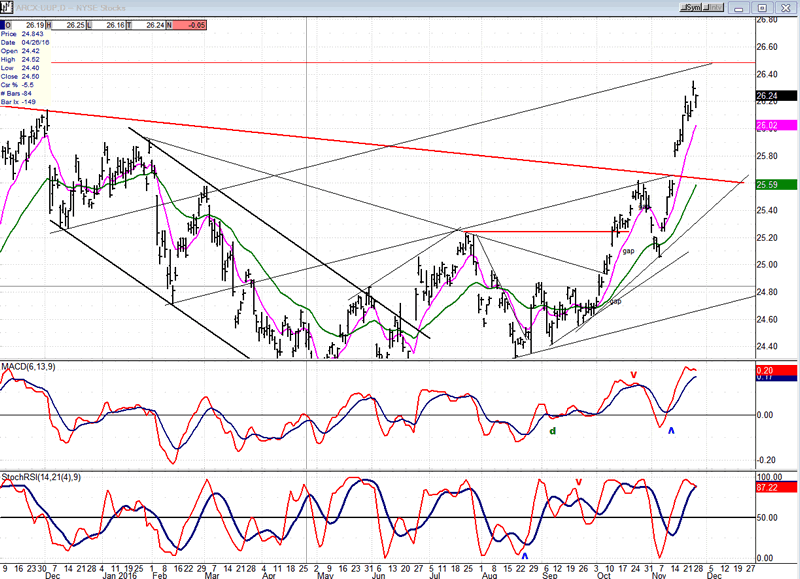
UUP cleared its intermediate correction top channel line with a wide gap and has since continued to advance, now nearing its early 2015 recovery high of 2650. There are higher projections which should keep this rally going into the foreseeable future, but some resistance around the 2650 high could stop the advance temporarily.
GDX (Gold Miners ETF)
GDX made a double bottom but failed to follow it up with a strong rebound. This could mean that the correction is not over, although the oscillators are beginning to show some positive divergence. The near-term trend is uncertain and it will require more price activity to clarify its direction. As mentioned last time, strength in the dollar – which could continue for some time – should be a deterrent against the start of a new uptrend in GDX; but if UUP begins to consolidate around this level, the rebound could extend toward the top of the red channel.
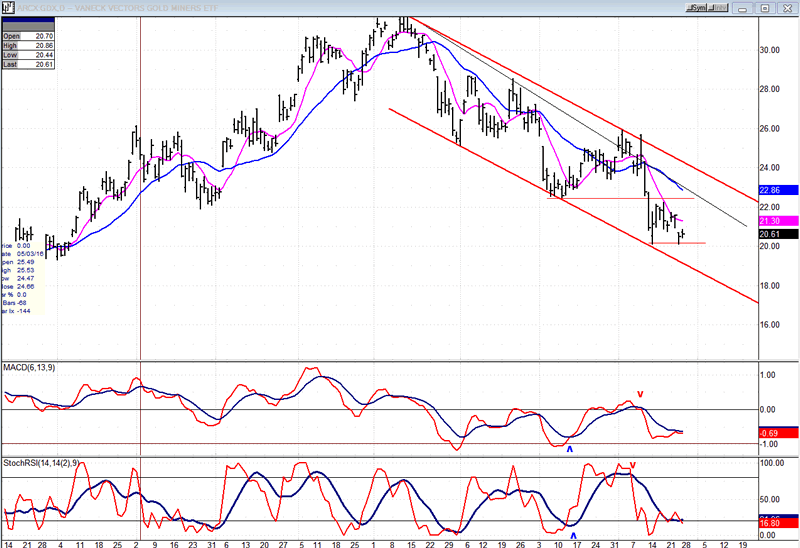
Note: GDX is now updated for subscribers several times throughout the day (along with SPX) on Marketurningpoints.com.
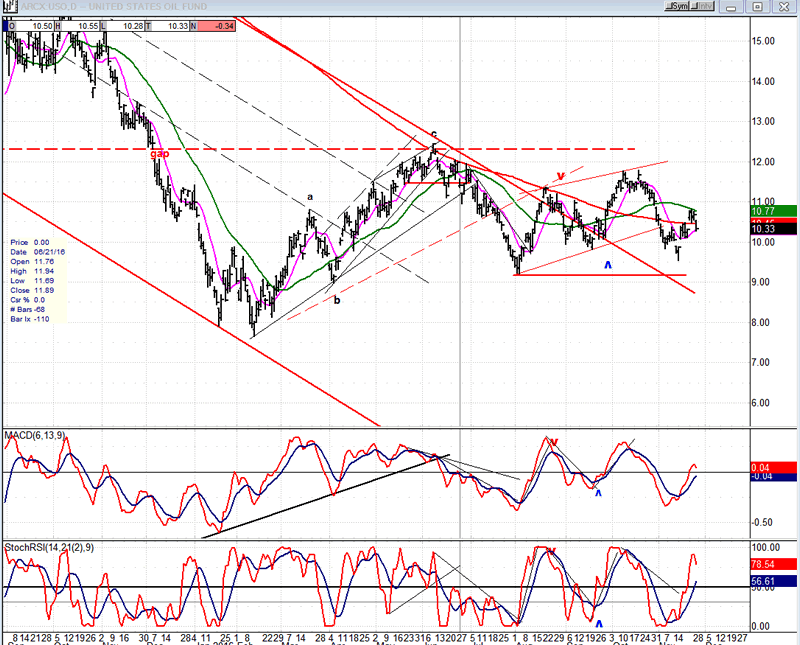
USO (U.S. Oil Fund)
USO completed a down phase near its former retracement low and started a rebound which, judging by the oscillator pattern, may not be over. However, if it turns back down from here, it may retest its February low.
Summary
Last week failed to bring about the expected pull-back, but SPX is now technically even more vulnerable to a short-term reversal.
Andre
FREE TRIAL SUBSCRIPTION
If precision in market timing for all time framesis something that you find important, you should
Consider taking a trial subscription to my service. It is free, and you will have four weeks to evaluate its worth. It embodies many years of research with the eventual goal of understanding as perfectly as possible how the market functions. I believe that I have achieved this goal.
For a FREE 4-week trial, Send an email to: info@marketurningpoints.com
For further subscription options, payment plans, and for important general information, I encourage
you to visit my website at www.marketurningpoints.com. It contains summaries of my background, my
investment and trading strategies, and my unique method of intra-day communication with
subscribers. I have also started an archive of former newsletters so that you can not only evaluate past performance, but also be aware of the increasing accuracy of forecasts.
Disclaimer - The above comments about the financial markets are based purely on what I consider to be sound technical analysis principles uncompromised by fundamental considerations. They represent my own opinion and are not meant to be construed as trading or investment advice, but are offered as an analytical point of view which might be of interest to those who follow stock market cycles and technical analysis.
Andre Gratian Archive |
© 2005-2022 http://www.MarketOracle.co.uk - The Market Oracle is a FREE Daily Financial Markets Analysis & Forecasting online publication.