


S&P500 Corporations Board and Executive Compensation Payments
Companies / Corporate News Aug 06, 2008 - 03:58 AM GMTBy: Richard_Shaw

 Executive compensation and board largess with high paid executives is a hot topic recently. That spurred us to look comprehensively at some factual comparative data on the total cost of boards of directors and top executive teams among the S&P 500 companies (proxy SPY or IVV).
For that purpose, we utilized the corporate governance database provided by The Corporate Library ( www.TheCorporateLibrary.com ) which tracks corporate actions, including executive compensation, and ranks public companies on several dimensions of corporate governance.
We found The Corporate Library database to be an excellent resource on all manner of questions about corporate actions, ranging from proxy issues, to board composition and cross linkages, to executive compensation and other matters. They roll it all up into a net corporate governance rating.
COST OF BOARDS OF DIRECTORS:
We identified the ten highest cost and the ten lowest costs boards of directors within the S&P 500, shown in the table below.
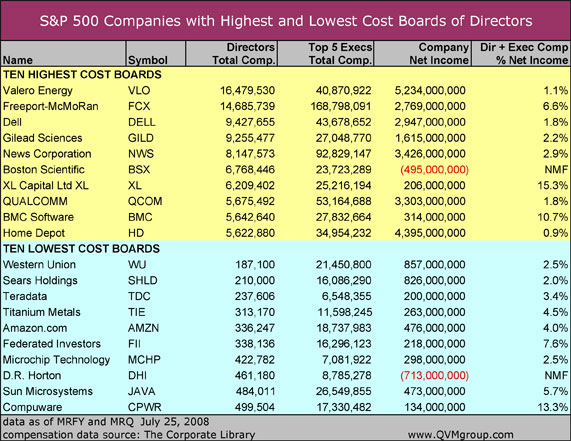
One concern with boards is that they may be so comfortable with their compensation that they are reluctant to vote against high executive pay packages. For that reason, if all other factors are equal (and they never quite are), we would by somewhat shy about investing in companies where board membership is a path to significant wealth.
On the other hand, board membership is real work if approached properly, and too little director compensation may not encourage effective oversight. For that reason, all other factors being equal, we would be cautious about investing in companies where the board doesn't get paid enough to be fully engaged -- or where the low board cost is due to too many company executives on the board who do not receive separate board pay.
To add perspective to the board compensation in the table, we also show the aggregate compensation of the top five executives for each company, as well as the sum of board cost and executive team cost as a percentage of company net income.
COST OF TOP EXECUTIVE TEAMS:
Over the entire S&P 500 the simple average of the aggregate compensation of the top five executives is $28.6 million, or approximately 2.4% of company net income. That compares to a simple average aggregate dividend payment to owners of the company of 45.7%
Those statistics are only for companies with positive earnings. Companies with loss positions in the most recent FY were excluded from the calculations.
[Note that "simple average" is unweighted, giving the largest company the same weight as the smallest company.]
In the table below, we show the ten highest cost executive teams and the ten lowest cost executive teams, and the percentage relationship between that compensation and net income.
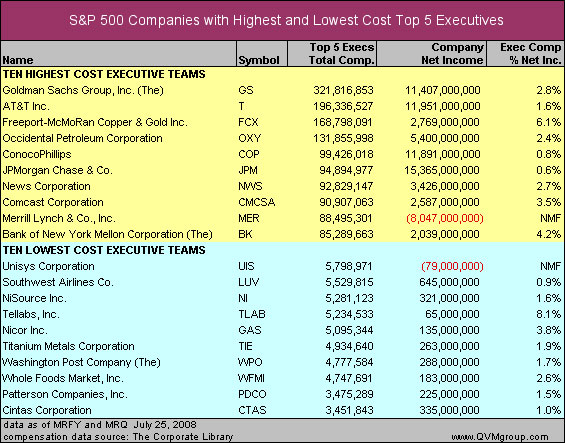
There isn't a great deal of difference in the total expense of executives between these highest and lowest cost teams. They both average about 2.4% to 2.5% of net income, which is also the simple average for the entire S&P 500.
EXECUTIVE TEAM EXPENSE RATIOS:
Comparing aggregate top executive team compensation to net income isn't exactly an expense ratio, because the net income is after the compensation expense, but comparing the one to the other in percentage terms is illuminating. We are calling it "expense ratio" here for lack of a better term.
In the table below, we show the 20 companies with the highest and the 20 with the lowest aggregate executive team compensation expressed as a percentage of the company net income.
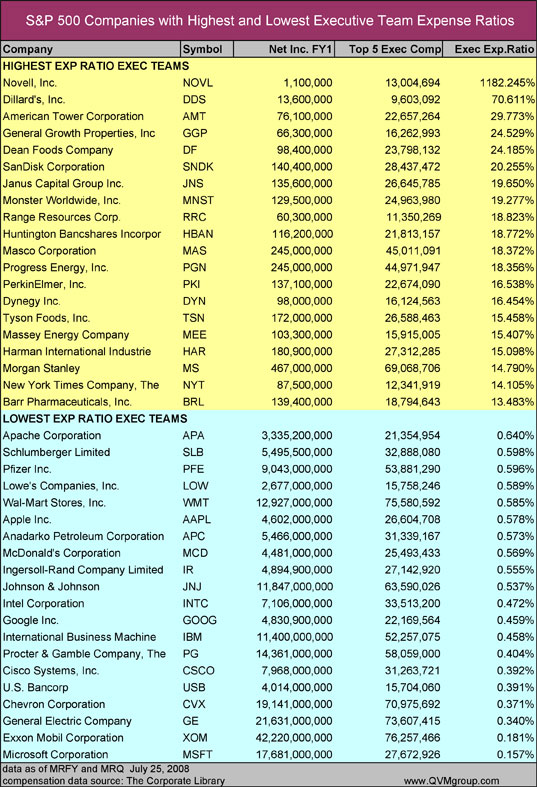
Not surprisingly, the companies with higher compensation expense ratios are generally smaller and with lower profits than those with low expense ratios.
Expense ratios in the 10+% range for the top five executives appear more like "carried interests" than compensation for management -- treating executives more like owners than top level employees.
While compensation must be "competitive" it also needs to be scaled to the size of the company. We are not comfortable with the top executives receiving large packages that have size on the same order of magnitude as the dividends (if any) paid to the owners of the company.
We did not study the dividend stream for these particular companies, but with dividends generally 0% to 50% of net income, we would not be comfortable seeing the top five executives receiving 10% to 20% or more of net income.
We favor companies with executives who are strongly motivated by their compensation packages (and who use their own money to buy real shares instead of being given options or loaned company money to buy shares). We prefer to avoid companies where executive compensation is so high that is looks more like a carried interest than wages and incentives.
By Richard Shaw
http://www.qvmgroup.com
Richard Shaw leads the QVM team as President of QVM Group. Richard has extensive investment industry experience including serving on the board of directors of two large investment management companies, including Aberdeen Asset Management (listed London Stock Exchange) and as a charter investor and director of Lending Tree ( download short professional profile ). He provides portfolio design and management services to individual and corporate clients. He also edits the QVM investment blog. His writings are generally republished by SeekingAlpha and Reuters and are linked to sites such as Kiplinger and Yahoo Finance and other sites. He is a 1970 graduate of Dartmouth College.
Copyright 2006-2008 by QVM Group LLC All rights reserved.
Disclaimer: The above is a matter of opinion and is not intended as investment advice. Information and analysis above are derived from sources and utilizing methods believed reliable, but we cannot accept responsibility for any trading losses you may incur as a result of this analysis. Do your own due diligence.
Richard Shaw Archive |
© 2005-2022 http://www.MarketOracle.co.uk - The Market Oracle is a FREE Daily Financial Markets Analysis & Forecasting online publication.