


Gold and Silver Near Significant Secondary August Bottom
Commodities / Gold & Silver Aug 07, 2008 - 02:11 AM GMTBy: Peter_Degraaf

 Upon analyzing over 30 years of data involving the gold price, we conclude that the seasonal lows usually occur in March and June. Quite often however, after the June low a secondary low is experienced in August. This secondary low is usually slightly higher than the primary low. People who have resisted the temptation to buy the June low will usually take advantage of this last opportunity before the start of the Christmas rally that seems to happen almost every year.
The past few days have seen the domineering short sellers do their utmost to drive the price into the basement, hoping that they might be able to reduce their ‘net short' position which had grown quite high. At some point the hedge funds and thinly margined investors run out of gold to sell to them and then the selling dries up. Next some technical buy signals commence to flash and buyers begin to outnumber sellers again, and this starts the next rising sequence.
Gold is amazingly cheap just now. At the current $880.00 it trades at just $30.00 (or 3.5%) above its 1980 high. During the 28 years since 1980, practically everything has risen sharply in price. From milk, bread, eggs, meat, fish, cars and houses everything else is going up in price by leaps and bounds. Cars and houses may be slipping in price at the moment, but they are still priced in multiples of their 1980 prices.
This comparison makes one wonder if the price of gold might be artificially depressed.
Actually that is precisely what GATA ( www.gata.org ). and Frank Veneroso ( www.venerosoassociates.net ) and John Embry ( www.sprott.com ) have been asserting for years.
If indeed someone or a number of people are involved in deliberately suppressing the gold price, then sooner or later the price will rise like a beach ball that has been pushed under water. The central banks of the world tried the suppressing game in the 1960's and they failed. The reason for such suppression is the knowledge that gold is an obvious barometer for price inflation. It is much easier to inflate the money supply with a constant gold price than it is with a rising gold price.
The amount of gold in existence is finite. It cannot be increased any faster than by 1.6% per annum (the rate at which mines are producing gold). Whereas the amount of money in circulation is currently expanding at double digit levels, on a worldwide basis. The US M3 money supply back in 1980 was 1.8 trillion dollars. Today, according to economist John Williams ( www.shadowstats.org ), the US M3 money supply has ballooned to almost 15 trillion dollars. Some of that extra money has the potential to move into gold.
The stage is set for a remarkable rise in the price of gold.
Let's look at some charts to see if it is safe to add to our gold position.
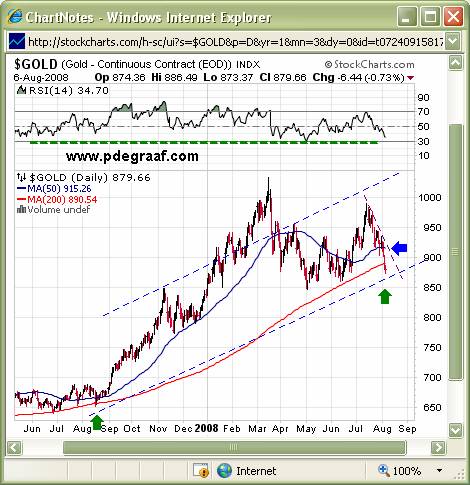
Featured is the daily gold chart. Notice the seasonal low in June, right on schedule. Next, the dip below the 200DMA earlier this week, very similar to a dip in August of 2007 (green arrows). That dip was the trigger for a move that took gold from $650 to $850 in 3 months.
A similar move now will take the price of gold to $1,075.00, surpassing the $1,030.00 high point set in March of this year. According to market expert Joseph Granville: “In a bull market, every time price moves near or below the 200DMA, it is an opportunity to buy.”
Notice how the 50DMA is in positive alignment to the 200DMA, while both of these averages are rising. That is the sign of a bull market in action.
Notice the RSI at the top of the chart has almost reached the 30 level where it usually bottoms in preparation for the next rise. A close above the blue arrow turns gold bullish again.
Next a look at the 7 – 8 week gold cycle.
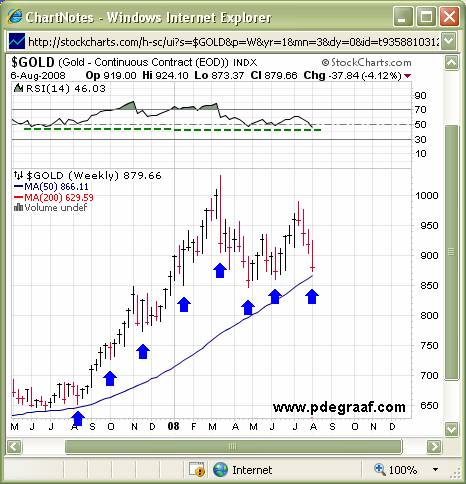
Featured is the weekly bar chart for gold. The blue arrows point to the bottom of the 7 – 8 week gold cycle. The fact that the current cycle touched the 50 week moving average during week # 8 provides confidence that the cycle may have bottomed. Notice the RSI at the top of the chart is at the 50 support level.
Next a long range look at gold and silver stocks.
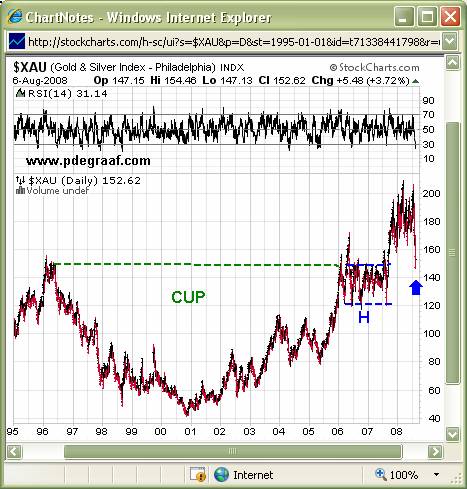
Featured is the bar chart for the XAU gold and silver stocks index. Price carved out a bullish multi-year ‘cup with handle' formation, with the breakout occurring late 2007. Price moved up to 200, where a correction set in. This correction took on the form of a test of the breakout. That test reached the rim of the cup a few days ago, and Wednesday it rebounded by 5.48 points (blue arrow). Once the test of a breakout is completed, price usually moves back in the previous direction and on to new heights. Now is a great time to be buying gold and silver stocks again!
Next a look at the US dollar.
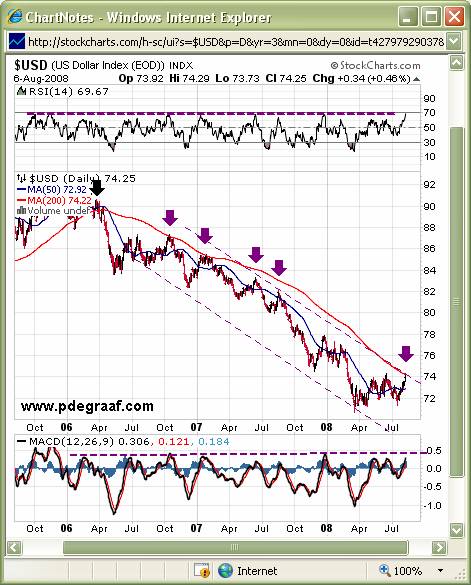
Featured is the 3 year bar chart of the US dollar index. The dollar is measured against 6 currencies: Euro, C$, J. Yen, Br. Pound, Swiss Fr. and Swedish Kr. A bear market in the US dollar commenced early 2006. Since that time at least 5 times the US dollar has tried to overcome the down-trending resistance line, or the 200DMA, without success. Today the dollar is trying again. If it is successful in rising above the 200DMA, it will mark the beginning of a new bull market. The fact that gold and silver were able to rise Wednesday despite a stronger dollar would indicate that gold traders expect the dollar to turn back down again. To bolster that conclusion you will notice that the RSI and MACD are bumping up against resistance (purple lines). We'll soon know the outcome. The fundamentals for the dollar are not great. Low interest rates and lots of monetary inflation, along with a ‘sick' banking sector.
Summary: Gold is involved in a multi-year bull market. The monthly advance, (as measured by the rising 200DMA) is 2.8% per month. Where else can you get 2.8% per month? Meanwhile monetary inflation is going on in dozens of countries. Some of this money is going to seek a safe haven and protection from monetary destruction.
Whenever ‘real interest rates' (short-term rates less CPI) turn negative (as they are today), money flows into gold. It always has, it always will. Today ‘real interest rates' in the USA , Canada and dozens of other countries are clearly negative.
Gold and silver are either at, or very close to the August secondary bottom.
By Peter Degraaf.
Peter Degraaf is an on-line stock trader, with over 50 years of investing experience. He issues a weekly alert to his subscribers. For a 60 day free trial, send him an E-mail itiswell@cogeco.net , or visit his website www.pdegraaf.com
DISCLAIMER: Please do your own due diligence. I am NOT responsible for your trading decisions.
Peter Degraaf Archive |
© 2005-2022 http://www.MarketOracle.co.uk - The Market Oracle is a FREE Daily Financial Markets Analysis & Forecasting online publication.