


US Dollar Bulls Surrender?
Currencies / US Dollar Feb 05, 2017 - 03:36 PM GMT

 The US dollar has now closed lower for 6 weeks in a row which is testing the patience of the bulls. This week the price action cracked the top rail of the horizontal trading range which is a negative, but not confirmation yet the trend has reversed down. There are several more layers of support that will need to be hit before I throw up the white flag and surrender to the bears.
This first chart is just a simple daily line chart which shows the US dollar closed just below the top rail today at 99.84.
US Dollar Index Daily Chart
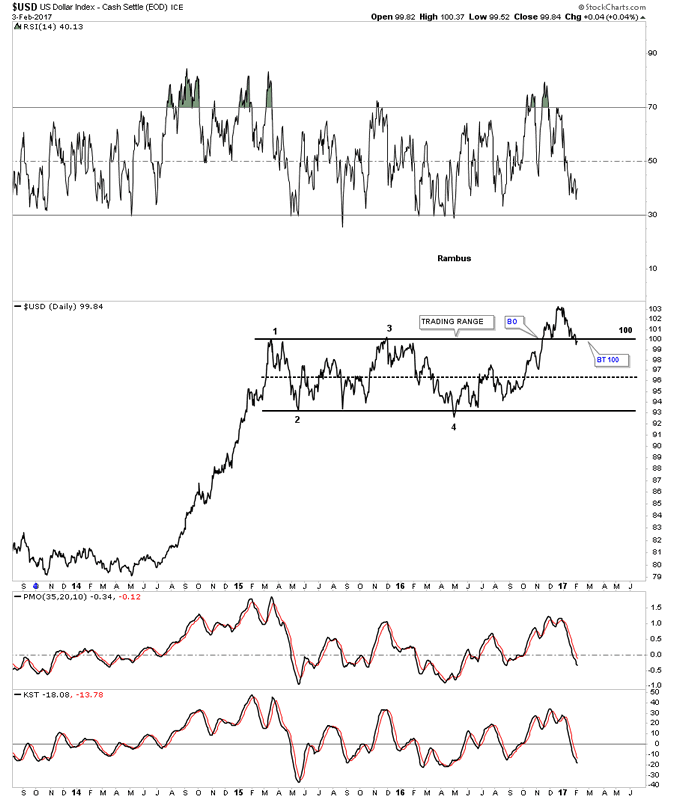
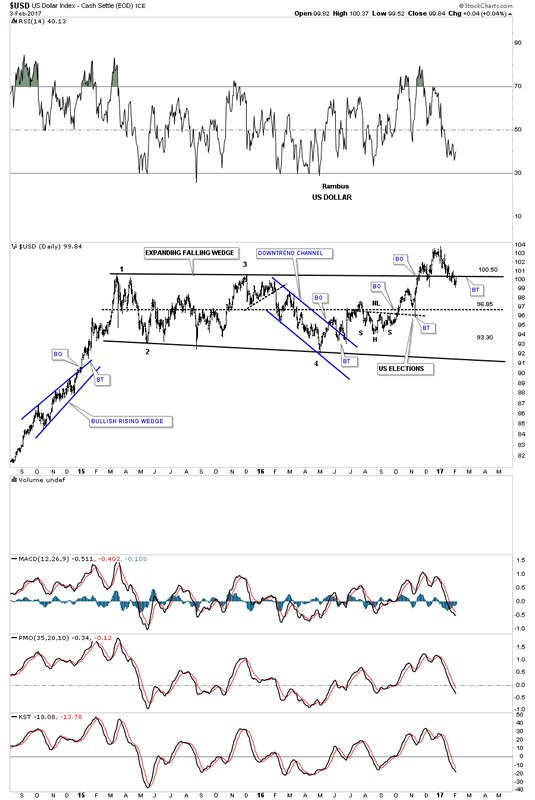
Below is the daily bar chart which shows the price action closing below the top rail of the horizontal trading range matching the low set back in December.
US Dollar Index Daily Chart 2
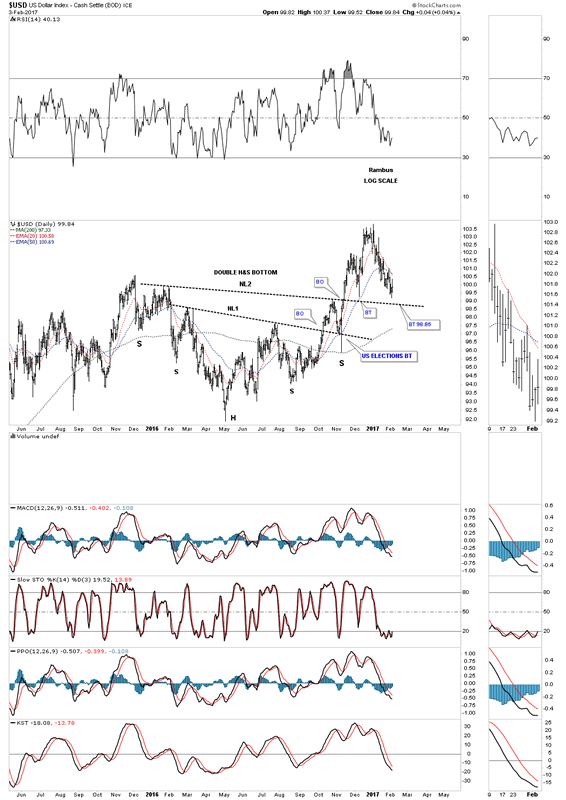
There is another pattern we've been following which is the double inverse H&S bottom that took about one year to build out. A complete backtest to neckline #2 would come in about a point lower than this weeks low at 98.85.
US Dollar Index Daily Chart 3
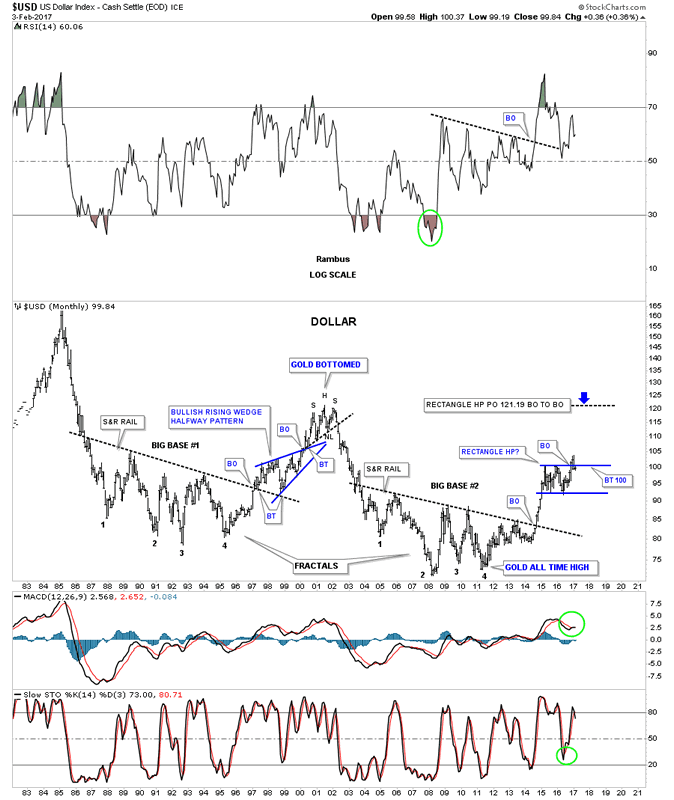
Below is the 35 year monthly chart which shows the two massive bases labeled big base #1 and big base #2 which are fractals of each other. Big base #1 launched the US dollar up to it bull market high in 2000 at the 120 area. The US dollar also formed a beautiful bullish rising wedge as a halfway pattern.
If big base #2 is just about equal in time and price to big base #1 then there should be enough energy to propel the US dollar at least up to the 120 area which would be the measured move from the blue rectangle trading range. That would also equal the high of the 2000 top where the US dollar built out a H&S top to reverse that bull market. At this point in time I don't see a topping pattern building out yet. It's possible that this trading range could morph in to some type of top but it should show itself at some point.
US Dollar Index Monthly Chart
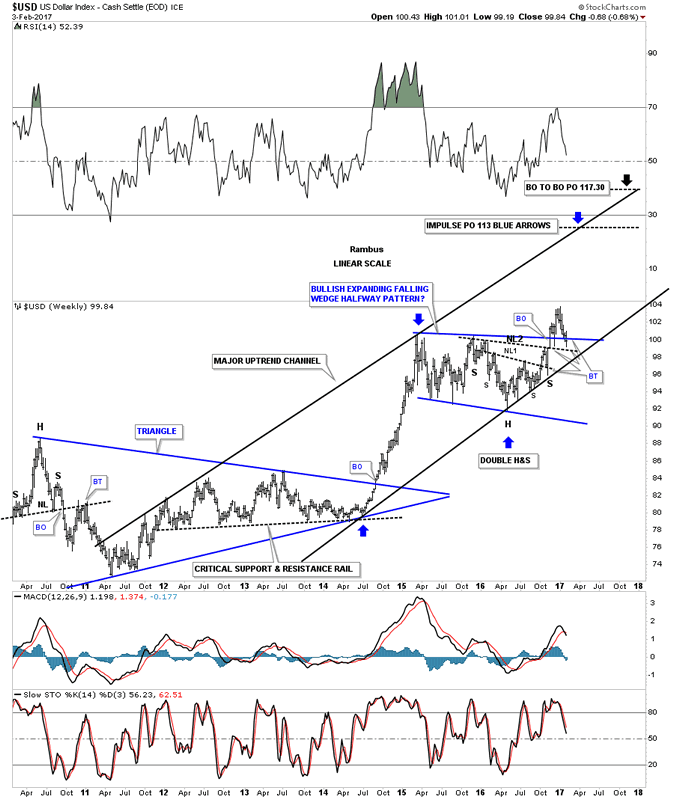
This next weekly chart for the US dollar puts all the pieces of the puzzle together. This chart shows the blue trading range with the double H&S bottom with neckline #2 almost being backtested this week. The major uptrend channel began in 2011 at the same time gold topped out. If the bottom rail of the major uptrend channel gives way that's where I wave the white flag and surrender to the bears.
US Dollar Index Weekly Chart
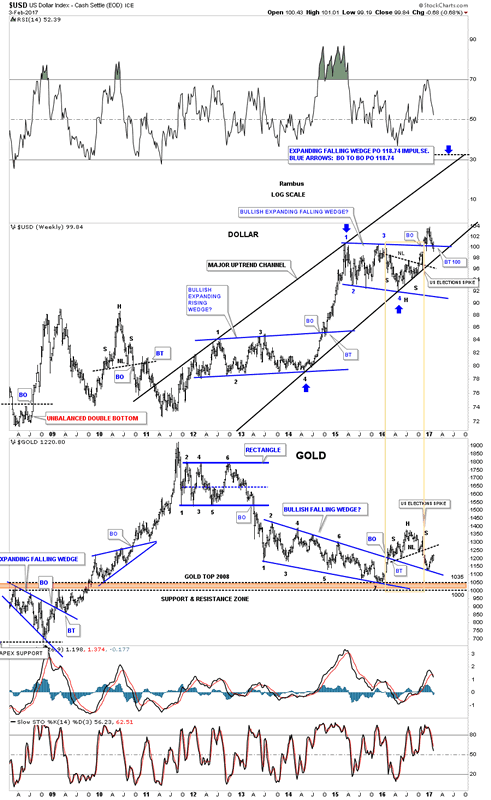
This next chart is a combo chart which has the US dollar on top and gold on the bottom. Looking to the right hand side of the chart you can see a long brown rectangle. That long brown rectangle shows you the inverse correlation between the US dollar and gold at least over the last year or so. If the US dollar is building out a H&S bottom then there is a good chance the gold is building out a H&S top which the brown rectangle shows.
US Dollar Index Weekly Chart 2
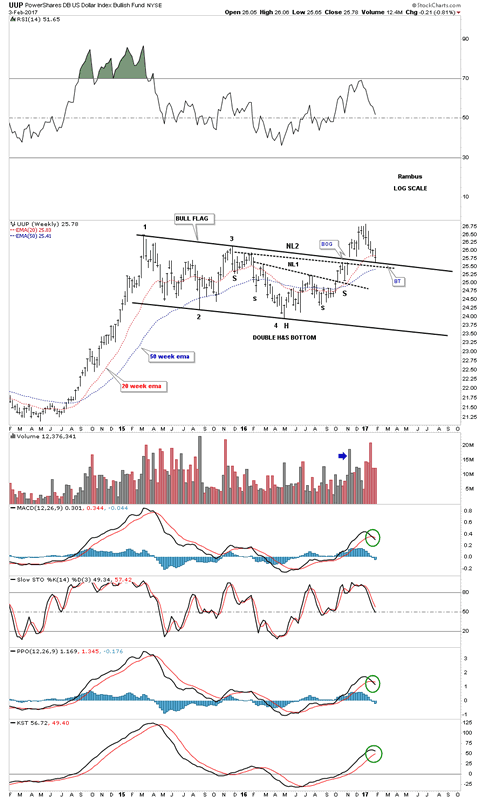
Instead of having a horizontal trading range the UUP has built out a bull flag as its consolidation pattern. A backtest to the top rail would come in around the 25.50 area which was almost hit this week with neckline #2 just below.
Power Shares US Dollar Index Weekly Chart
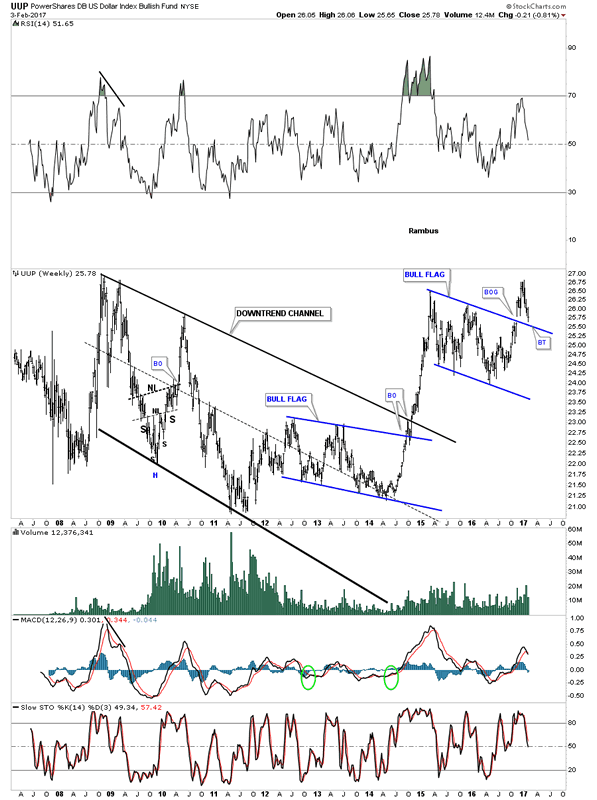
After putting in its bear market low in 2011 the UUP ( US Dollar ETF) has been in a strong bull market creating its first consolidation pattern just below the top rail of the downtrend channel. After completing that first impulse leg up, that started in the summer of 2014, the UUP went on a vertical move up to the first reversal point in the upper blue flag where it need to rest.
Sometimes backtests can be quick and clean while other times they can try your patience and makes you question whether you are right or wrong. As long as support continues to hold I have to remain a bull, but if I see support being broken in a serious way I will have no problem reversing my stance from bullish to bearish on the US dollar.
Have a great weekend and enjoy the Super Bowl. All the best...Rambus
Power Shares US Dollar Index Weekly Chart 2
All the best
Gary (for Rambus Chartology)
FREE TRIAL - http://rambus1.com/?page_id=10
© 2017 Copyright Rambus- All Rights Reserved
Disclaimer: The above is a matter of opinion provided for general information purposes only and is not intended as investment advice. Information and analysis above are derived from sources and utilising methods believed to be reliable, but we cannot accept responsibility for any losses you may incur as a result of this analysis. Individuals should consult with their personal financial advisors.
© 2005-2022 http://www.MarketOracle.co.uk - The Market Oracle is a FREE Daily Financial Markets Analysis & Forecasting online publication.