


Gold Plunges Towards Test of Key Support at $850
Commodities / Gold & Silver Aug 09, 2008 - 03:03 PM GMTBy: Merv_Burak

 I think we all want to forget this past week and look ahead (all except those who had been on the short side, that is). We are now at a very significant support so let's see if it looks like gold will hold or fold.
GOLD : LONG TERM - Things got real interesting this past week so I thought I'd bring out my very long term chart of gold and see where we are at. About the only difference between the very long term chart and the long term chart is the use of a yearly (52 week) momentum indicator versus 30 weeks for the long term and the use of a yearly simple moving average line versus a 40 week weighted moving average line in the long term.
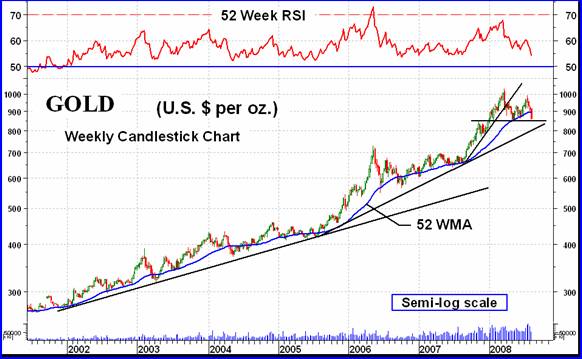
There are a few things of interest in this chart. First are the Merv's FAN Principle trend lines. We have an excellent example of an accelerating bearish FAN here. The third FAN trend line is often referred to as the “blow-off” stage leading to a bear market after the crossing. So far, so good (or bad, depending upon your outlook). We had the crossing in March. The rally attempt in June-July as a very weak one and could not last.
The other very obvious feature is the negative divergence in the early 2008 action versus the peaks in 2006. The price of gold zoomed into new highs but it was not confirmed by the momentum indicator.
All is not yet lost, from the very long term perspective. As we see, the momentum indicator has not yet crossed into the negative zone, so there is a little bit of comfort there. Although the price of gold has crossed its very long term moving average line I wait for the line itself to turn downward as a confirmation. That has not yet happened. We are also still above a major support level. So, although things do not look promising they are not yet all lost.
As for the normal long term indicators, they are somewhat less positive. Gold is below its moving average line and the line has just turned to the down side. The momentum indicator is still just a little above its neutral line, in the positive zone, but below its negative trigger line. It would not take much more negative days to push this momentum indicator into the negative zone. The volume indicator continues to act better than the other indicators but as I so often caution, this indicator has a habit of being a lagging indicator at market tops. All in all, the long term rating has just slipped into a BEARISH rating this week.
INTERMEDIATE TERM
All eyes are on that $850 support. We are still a little above it but moving lower fast. This week I moved over to using the Dec gold contract data as it is by far the most active contract month with the highest open interest. Still, if I had stayed with the previous Aug contract data there would really have been no difference in the weekly analysis. The Friday low for the August contract was still slightly above the support.
Although the price of gold held above the support the same could not be said for the momentum indicator. It had just moved into lower territory versus its previous May lows. It seems to be suggesting that the internal strength of the price move is weaker than it seems. Lower prices and a breach of the support is therefore suggested, although I will wait for that to happen.
As for the indicators, gold is below its negative sloping intermediate term moving average line. The momentum indicator, as mentioned, is below its neutral line in the negative zone and below its negative trigger line. Although acting stronger than the other indicators, the volume indicator has moved below its negative sloping trigger line for a negative message. Putting it all together the intermediate term rating is BEARISH .
SHORT TERM
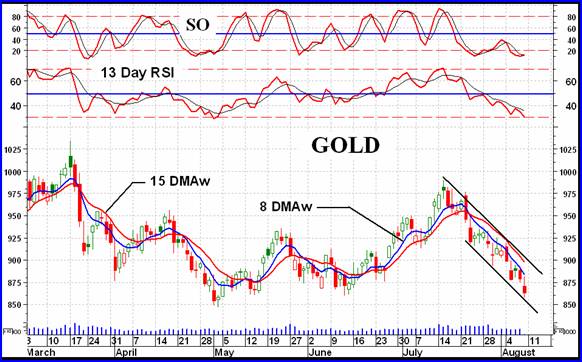
The short term direction has been in a steady down draft for some four weeks now. A rest or bounce of some sort is overdue, but will we get it? The move looks decidedly like it wants to take out that support at the $850 level. It just might do that as there is no evidence in the chart or indicators to tell me that the trend is about to reverse. About the only positives one can hang on to is the fact that the short term momentum indicator is at a point where a previous rally started. The aggressive Stochastic Oscillator is also in its oversold zone so one might expect a rally from there also. However, a rally has not yet begun so one cannot say we WILL get one anytime soon. I like to see the start of a rally before declaring it so. For now everything on the short term is negative and therefore the rating remains BEARISH .
As for the immediate term direction, that is still to the down side although the SO is leveling off and that might be an indication that the price just might do likewise.
SILVER
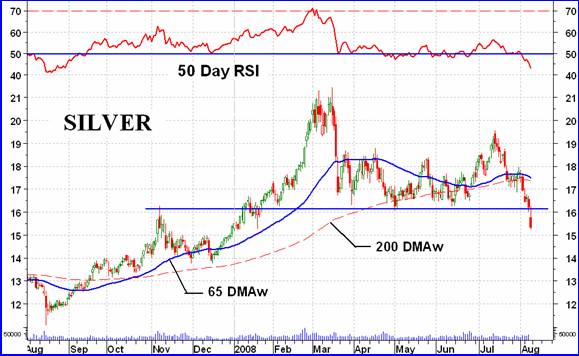
Although gold is sitting just above its major support level silver has already breached its level, and breached it decisively. The full Friday action was below the level while the intermediate term momentum indicator has been moving deeper into its negative zone. About the only potential positive here is the fact that the momentum indicator is at about the same level it was at last year, just before the start of a 6 month rally. The silver action over the next few days should give us a clue if we are going to repeat last year's action or continue to go deeper into the hole.
PRECIOUS METALS STOCKS
Most investors in precious metal stocks (gold & silver) basically look at the PHLX Gold & Silver Sector Index or the AMEX Gold BUGS Index to understand what's going on in the precious metals market. But these Indices reflect the actions of only a select short list of stocks and more importantly they reflect the actions of the higher weighted stocks in their Indices. Many of their smaller Index stocks have little or no impact upon the Index value and therefore do not really contribute to an understanding of the overall precious metals market. That's where I think my Merv's Gold & Silver 160 Index comes in.
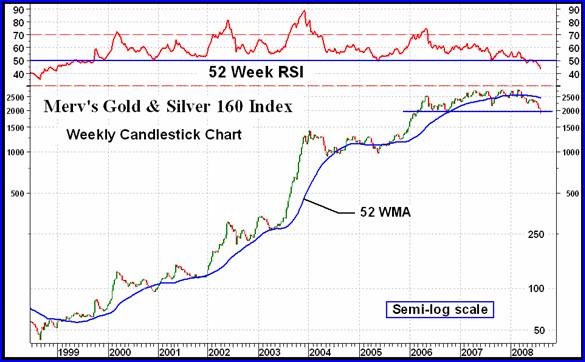
The Merv's Gold & Silver 160 Index (let's just call it the 160) reflects the actions of 160 gold and silver stocks, including the top 100 stocks traded on the North American market, by market value. Since the Index is calculated giving each stock an equal effect on the Index the Index reflects the AVERAGE performance of these 160 stocks. As the Index includes everything from the highest quality to some real cats and dogs it therefore reflects the overall precious metals market far better than any of the major North American Gold Indices.
What we see here is the Index from the start of its bull market in 1998 (yes, the overall precious metals stocks started their bull market a lot earlier than most understand from only looking at the major Indices) to the present. It's been quite a ride but now it looks like the ride is over, at least for a while. We have a two and a half year topping activity that has just broken below its support. The topping activity was accompanied by a steadily weakening momentum until the momentum itself has now dropped into its negative range for the first time since the start of the bull. The moving average is another indicator of a serious reversal of trend. The Index fell below the moving average earlier in the year and the average has now turned definitely downwards. All of these indicators are from the very long term perspective. The moving average and momentum indicators are one year time frame indicators (i.e. 52 week).
Now, nothing is ever perfect and things could change for the better tomorrow but as long as the charts and indicators are what they are one would be taking inordinate risks buying stock at this time, regardless what anyone else may say. The odds at this point in time are not favorable. Out of the 160 stocks in the Index only 9 are rated as POS (or BULLISH) for the long term and only 7 are rated POS on the intermediate term. Another way of looking at this is your odds of picking a winner are about 1 in 22.
One might ask how far or how long this bear will last. Well, just looking at the chart one can expect another 35% to 50% drop in the Index to get it to the next major support area, the area of the 2004 and 2005 activity.
When the stocks finally turn the charts and indicators will let us know, in the mean time the turn has not yet come.
Merv's Precious Metals Indices Table
Well, that's it for this week.
By Merv Burak, CMT
Hudson Aero/Systems Inc.
Technical Information Group
for Merv's Precious Metals Central
For DAILY Uranium stock commentary and WEEKLY Uranium market update check out my new Technically Uranium with Merv blog at http://techuranium.blogspot.com .
During the day Merv practices his engineering profession as a Consulting Aerospace Engineer. Once the sun goes down and night descends upon the earth Merv dons his other hat as a Chartered Market Technician ( CMT ) and tries to decipher what's going on in the securities markets. As an underground surveyor in the gold mines of Canada 's Northwest Territories in his youth, Merv has a soft spot for the gold industry and has developed several Gold Indices reflecting different aspects of the industry. As a basically lazy individual Merv's driving focus is to KEEP IT SIMPLE .
To find out more about Merv's various Gold Indices and component stocks, please visit http://preciousmetalscentral.com . There you will find samples of the Indices and their component stocks plus other publications of interest to gold investors.
Before you invest, Always check your market timing with a Qualified Professional Market Technician
Merv Burak Archive |
© 2005-2022 http://www.MarketOracle.co.uk - The Market Oracle is a FREE Daily Financial Markets Analysis & Forecasting online publication.