


Stock Market Sentiment, Re-Fueled Along the Way
Stock-Markets / Stock Market 2017 Apr 28, 2017 - 06:43 PM GMTBy: Gary_Tanashian

 It’s a big picture view with a story to tell. People are micro-managing the VIX, talking about how it either doesn’t work anymore, if it ever did, or is forecasting extreme doom imminently (through investor complacency). But what is “imminently”? Is it next month or is it the 2-3 years that this indicator often wallows along the bottom of its support zone before overseeing a coming Armageddon? Sure, it started wallowing in the zone back in 2013, but then the ‘fuel stops’ that were ultimately bullish (the 2010, 2011 and 2015 corrections) cleared the overhead inventory of investors out of the markets.
Sometimes you’ve got to let a picture marinate and tell its story, not impose your (relatively) hypersensitive brainwaves on it. The story this thing is telling is that Armageddon ’08 surely was a massive sentiment reset (of much greater power and significance than I originally thought it would be, when I got bullish in early 2009). On top of that big sentiment event that cleaned the markets out to a fully sanitized state, there were 3 subsequent eruptions of bearishness that may have reinforced the message of the 2008 disaster, sternly reminding casino patrons that this thing is not safe.
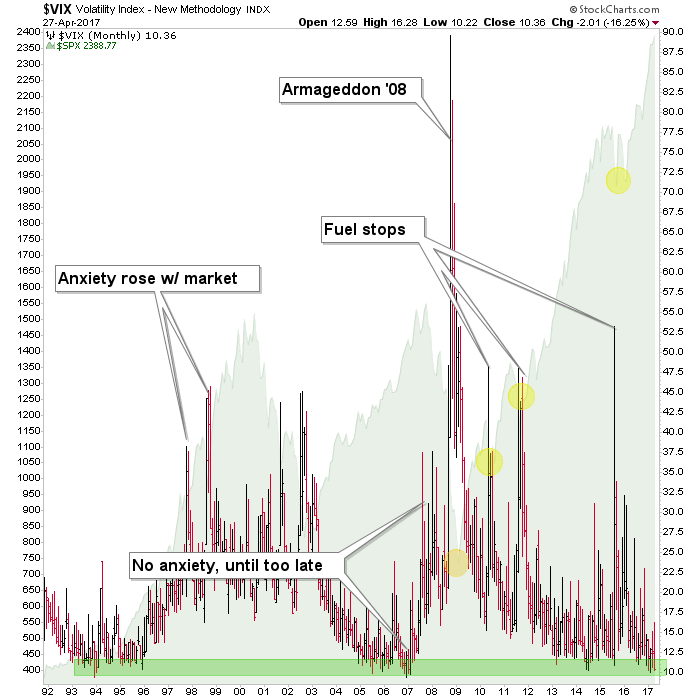
And yet up go the prices of stocks, and down goes the VIX. The problem for bears who would like to sharpen their claws for a ‘fish in a barrel’ opportunity, is that 3rd fuel stop of the current bull market, from 2015. VIX is in the zone, but how many months will it wallow there thanks to the 2015 clean out?
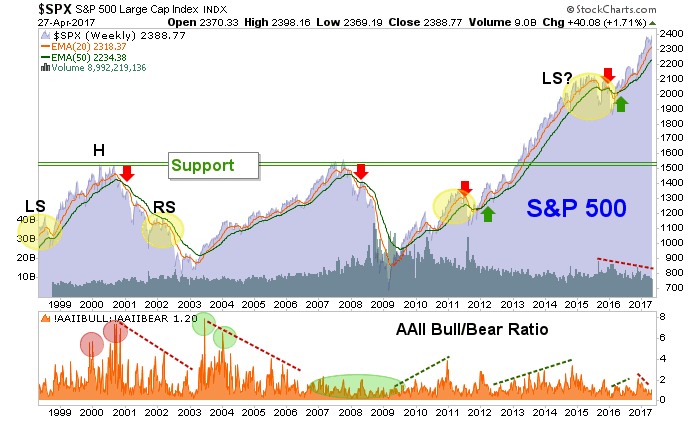
Now let’s look again at the weekly chart of the S&P 500 along with the stubbornly un-bullish AAII (Individual Investors). In NFTRH we have had an open question about whether the AAII will need to finally jerk all-in, similar to 2000, or at least heavily-in, similar to 2010 and 2014 before the bull finally terminates.
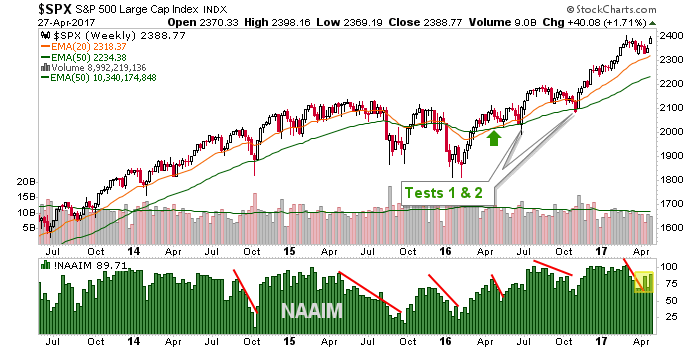
Here is another version of the chart, showing the NAAIM (Investment Managers) having sold down during the most recent market consolidation. Now there they go, popping with the market again (‘oh, it’s okay after all’ think the best and brightest managing other peoples’ money… ‘back in the pool!’). These negative sentiment squalls are bullish in a bull market.
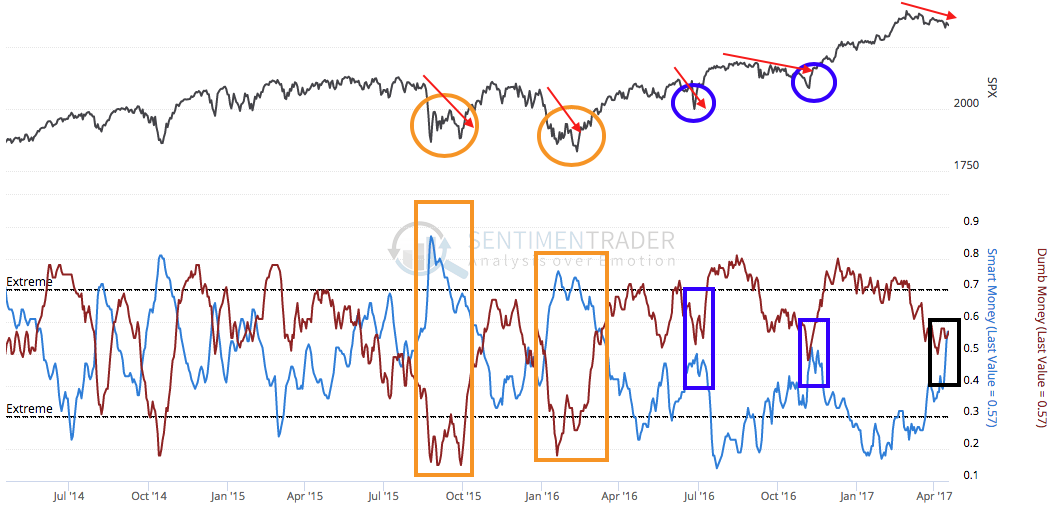
In NFTRH 444, we took a look back using the graphic below, at the sentiment events (major corrections) that re-fueled the market in 2015 (into 2016), along with the events (blips, really) that have reset the bullish course, after the market gave its bullish signal (to end the last significant correction) last spring (ref. the moving average cross on each of the two weekly charts above).
The question on the corrective consolidation that just ended was ‘mini or maxi?’ with the answer proving to have been ‘mini’, which makes sense because the 3 most recent reactions have come after a bull signal as described above. This was unlike the 2015 and 2016 events, which looked for all the world like the beginning of a bear market. From Sentimentrader.com (w/ my mark ups)…
The bottom line? Well for one thing, let’s realize that it is a high risk market because it has, much like the bond market and gold, been distorted by now-systematic and ever more experimental Central Bank policy. So to be a bull you have got to accept huge amounts of risk, with timing being the issue. One day the house of cards will blow down. But as the VIX chart at top shows that day could be out on the horizon. We just don’t know, and that is all part of the risk profile.
How do I handle it? I am and have been a bull for about the last year. I handle the risk by making sure to keep high cash levels, take enough profits (and limit losses) and rebalance into areas that seem favorable for the times at any given point. But the inflation since 2008 (and folks, make no mistake it has been full frontal inflation) has gone directly into US stocks (for an interesting view of how Europe may follow what has been the post-inflationary US experience, see this article by the Macro Tourist).
The downside to that? Well, we had an NFTRH+ update on Lam Research (LRCX) about 10 months ago. I took my profit at a reasonable point and LRCX is now about $40/share higher than our original target! Tough racket, when the bulls just keep driving to what seem like ridiculous heights. So if you’re going to play you’re going to accept risk. But you can mitigate that with cash management and continual rebalancing (incl. Europe/Global?). Or you can just buy the Semi sector today along with the momos and hope for the best. ← that is obviously a joke, folks.
Subscribe to NFTRH Premium for your 40-55 page weekly report, interim updates and NFTRH+ chart and trade ideas or the free eLetter for an introduction to our work. Or simply keep up to date with plenty of public content at NFTRH.com and Biiwii.com. Also, you can follow via Twitter ;@BiiwiiNFTRH, StockTwits, RSS or sign up to receive posts directly by email (right sidebar).
By Gary Tanashian
© 2017 Copyright Gary Tanashian - All Rights Reserved
Disclaimer: The above is a matter of opinion provided for general information purposes only and is not intended as investment advice. Information and analysis above are derived from sources and utilising methods believed to be reliable, but we cannot accept responsibility for any losses you may incur as a result of this analysis. Individuals should consult with their personal financial advisors.
Gary Tanashian Archive |
© 2005-2022 http://www.MarketOracle.co.uk - The Market Oracle is a FREE Daily Financial Markets Analysis & Forecasting online publication.