Gold Miner Stocks, Metal Proxies and Gold Bugs in Hades ? or just close
Commodities /
Gold and Silver Stocks 2017
May 05, 2017 - 11:41 AM GMT
By: Denali_Guide

 In a place called PURGATORY, hundreds of Gold Miner Stocks, and thousands of GoldBugz find themselves stranded today as the bodies of JNUG and GDXJ twist in the wind, as they wait to be cut down from the gallows of the GDX / GDXJ RE-Balance.
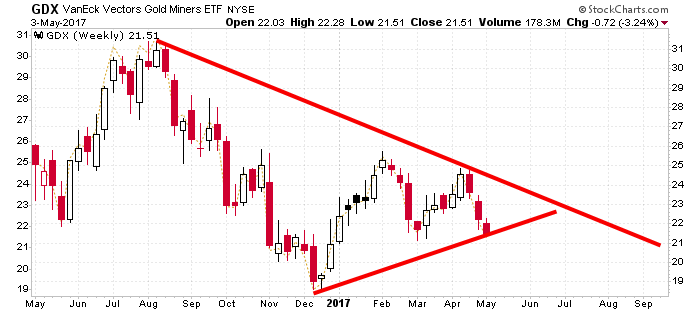
So that is GDX
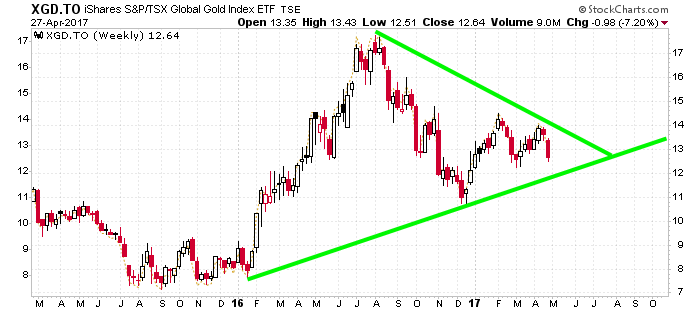
Now on the Canadian Side
And yet again the same issue exists on both sides of the US-CAN border.
Just doesnt look as relief from this trading range contained in either of these
triangles, looks like it MUST resolve before Mid July. It could resolve before that if the forces driving the sometimes linked prices of Spot Gold and the Indexes. But we have seen those two items move eccentrically, and even in opposite directions many times.
The moves of each are related but not in lockstep. The Spot responds to the market for physical, where as the Indexes such as GDX, XGD.To, more relate to the demand for the shares. The ruffles under the waves in shares, to me, reflect on the fact that there is long term demand for the shares, and that GoldBug inclined investors want the safety of ETF's, and in greater quantity, that if applied to the miner shares directly may boost them far beyond the proportion that the ETF's moved. This will wash thru the system by the end of the summer I am guessing, figuring that for being a "Decent Interval".
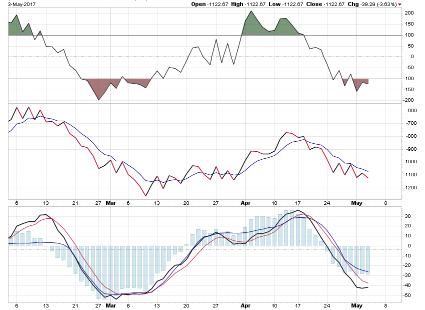
So rather than try to sort this all out, per se, lets jump back to the Base from which we derive some of our other charts, GIMBO. This is GIMBO yesterday:
WHAT WE ARE SEEING HERE IS:
The graphic representation over time of the Advances mathematical edge over Declines in the Precious Metals Sectors, or deficit. That's the jagged line in the middle panel, bisected by a 6 interval Exponential Moving Average.
Panel by Panel:
Top Panel, is CCI, which is like an acceleration pendulum like the kind that used to be used to trigger airbags in car collisions. It has crashed into the
BASE-Ment, mean it can begin or has based. That brown area indicates far over-extension to the downside.
Middle Panel, shows the plurality of Precious Metals Miners stock advances, over the declines or the deficit there. It helps us assess direction.
Bottom Panel, is the Blue Bars of the Moving Average Convergence/Divergence, overlaid with the rate of acceleration in that MACD (default values). All the solid lines represent the CHANGE in acceleration of the TREND. Thus all that measures the underlying breadth in the STOCKS, are communicating the slowing down and ending of the Declines over Advances, this week as we watch.
Translated into "HOW-2-MAKE-BUX", it means we are near the inflection point, for a potential uptrend. Of course this feels like a batter in a baseball game having 2 strikes, and 3 balls, a full count from which something good or bad will come on the next pitch. Or not. Many times we've watched a batter intentionally and maddingly, continually( it seemed), to foul off pitches till he got the one he wanted to hit. Its done. As well, when you think a market cannot do that any longer, you find out it can and your only refuge is patience and discipline. Can you wait it out ? Afraid to miss THE Signal? Sign up.
Also sign up for your free monthly PICK from the Best of Peak Pix, when your on our mailing list, free every month. Good Luck. DG
By Denali Guide
http://denaliguidesummit.blogspot.ca
To the the charts involved, go here, to my Public Stock Charts Portfolio, and go to the last section. All charts update automatically. http://stockcharts.com/public/1398475/tenpp/1
© 2017 Copyright Denali Guide - All Rights Reserved
Disclaimer: The above is a matter of opinion provided for general information purposes only and is not intended as investment advice. Information and analysis above are derived from sources and utilising methods believed to be reliable, but we cannot accept responsibility for any losses you may incur as a result of this analysis. Individuals should consult with their personal financial advisors.
© 2005-2022 http://www.MarketOracle.co.uk - The Market Oracle is a FREE Daily Financial Markets Analysis & Forecasting online publication.