


Gold Breaks Long-term Bull Market Support
Commodities / Gold & Silver Aug 17, 2008 - 06:08 AM GMTBy: Merv_Burak

 Well I guess this past week will be remembered for both gold and silver, with silver declining twice as fast as gold. Stocks also took a bounding but they have been taking a bounding for some time now. What next? That's really the $64 question.
GOLD: LONG TERM
Here we are with that long term P&F chart. While surfing the ‘net I came across another analyst who uses a 2 unit reversal P&F chart for gold with $15 units (very rare). This analyst drew the trend line as one would normally draw on the normal bar charts, i.e. touching the lows of major reaction points. Although I have used this method on occasion, and it is a valid method of drawing a P&F trend line, I usually prefer the 45 degree lines for a variety of reasons. However, here is how the trend lines would have looked if drawn touching the lows. Not bad, eh!
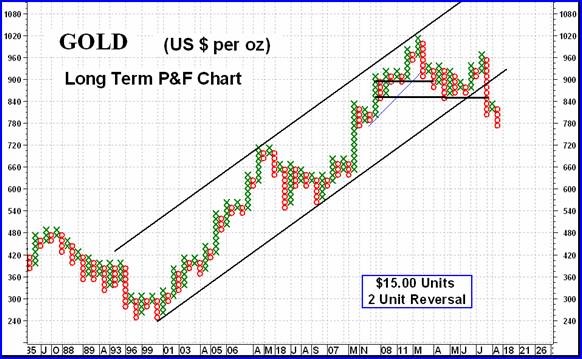
As shown on the chart (black lines) one can calculate two projections using the horizontal count method. The first count would have been the one based upon a 45 degree trend line break. That would take us down to the $660 level. Still some distance but not unreasonable. The second count based upon the full bear market trend line break would take use back to $360, which is basically to the start of the bull market. That looks unreasonable at this time, but is still there to bug us.
If we take the recent sharp decline in price and do a vertical count we would get a projection to the $645 to $690 area, depending upon what top we use as the high. So, it looks like the $660 is not a bad projection to go by for now.
Just a quick word about that very long term gold chart shown last week. Although I did not state so the rating for the very long term based upon the chart and indicators would have been a – NEUTRAL rating. This week, unfortunately, the rating slipped another notch and is now a full BEARISH rating.
Going to my normal long term chart and indicators, they turned fully bearish last week and as you can imagine, nothing has changed that rating this week. Gold remains below its long term negative sloping moving average line and the momentum indicator remains in its negative zone, below its negative sloping trigger line. The volume indicator has been acting better than the other long term indicators but as cautioned, it often is a lagging indicator at market tops. However, it dropped below its trigger line a few weeks back but the trigger remained positive. This past week the trigger went negative. The BEARISH rating for the long term therefore remains in place.
INTERMEDIATE TERM
With gold breaking support levels like they did not exist nothing in the intermediate term has changed, except for the worst. As with the long term all indicators, including the volume indicator, are negative so I wouldn't go through the drill again. The Intermediate term rating remains BEARISH.
SHORT TERM
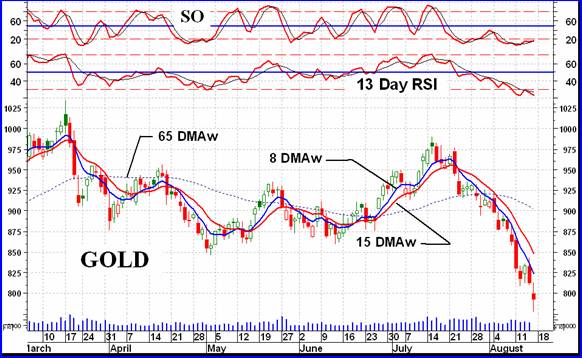
I guess one can only look at the chart and cry. Trying to pick some glimmer of good news is next to impossible. The chart says it all. On the short term gold continues its plunge that started in late July. It remains below its negative sloping moving average line (15 DMAw). The momentum indicator (13 Day RSI) continues in its negative zone and below its negative trigger line. It also remains in its oversold zone. A move out of this zone would be a precursor to a short term trend reversal, but that's not here yet. The daily volume action continues low but compatible with its action over the past few weeks so it doesn't say anything in particular. All in all, the short term rating remains BEARISH.
Just a note but a commodities trader could do a lot worse than just trading on the direction of the short term moving average line, or for a little extra caution, on the crossing of the very short term moving average line and the short term.
As for the IMMEDIATE direction of least resistance, that continues to be in a downward direction. The only glimmer of hope seems to be the fact that the more aggressive Stochastic Oscillator (SO) is slowly moving higher, above its positive sloping trigger line, however, the SO is still inside its oversold zone and one would wait until it at least breaches its oversold line.
SILVER
Last week I showed a chart of silver. It was not a pretty chart. It didn't get any better during the past week. A plunge of 16.9% versus gold at 8.2% gives silver a lead in the downward spiral. Silver is now very close to the start of its bull move in 2007. Gold, on the other hand, is only half ways to the start of its 2007 bull move. Whatever is said about gold is even worst for silver.
PRECIOUS METAL STOCKS
What more can one say that hasn't been said last week. The chart of the Merv's Gold & Silver 160 Index showed a move below a two and a half year support and the Index is now on its way to the next support level. That would be in the area of the 2004 to 2005 lateral move. If one took the mid-level of that area we then still have another 25% drop to go. Between here and the next support there is little market action by the 160 stocks to expect an earlier support.
Looking over the performances of the various Indices in the Table below, there is no gold sector that is acting strong. The quality are in trouble, the speculative are also. The gambling stocks sure have seen better days. In reviewing the various Index declines from their highs earlier in the year, the silver Indices had the greatest declines. Both the Qual and Spec-Silver Indices had declines of 43% since their high earlier in the year. The other Merv's Indices had declines varying from 36% to 39% with the heavily silver loaded Spec-Gold Index equaling the silver Indices at 43%. Going to the major Indices, The AMEX Gold BUGS Index declined 39% while the PHLX and S&P/TSX Global had declines of 33%.
Nothing here indicates that the declines have run their course. There is still a lot they could do, after all the declines in earlier periods were in the order of 80%. I don't expect such declines this time but who knows.
Merv's Precious Metals Indices Table
Well, that's it for this week.
By Merv Burak, CMT
Hudson Aero/Systems Inc.
Technical Information Group
for Merv's Precious Metals Central
For DAILY Uranium stock commentary and WEEKLY Uranium market update check out my new Technically Uranium with Merv blog at http://techuranium.blogspot.com .
During the day Merv practices his engineering profession as a Consulting Aerospace Engineer. Once the sun goes down and night descends upon the earth Merv dons his other hat as a Chartered Market Technician ( CMT ) and tries to decipher what's going on in the securities markets. As an underground surveyor in the gold mines of Canada 's Northwest Territories in his youth, Merv has a soft spot for the gold industry and has developed several Gold Indices reflecting different aspects of the industry. As a basically lazy individual Merv's driving focus is to KEEP IT SIMPLE .
To find out more about Merv's various Gold Indices and component stocks, please visit http://preciousmetalscentral.com . There you will find samples of the Indices and their component stocks plus other publications of interest to gold investors.
Before you invest, Always check your market timing with a Qualified Professional Market Technician
Merv Burak Archive |
© 2005-2022 http://www.MarketOracle.co.uk - The Market Oracle is a FREE Daily Financial Markets Analysis & Forecasting online publication.