Reconciling the US Dollar Outlook with the Super Bullish Gold and Silver COTs
Commodities / Gold and Silver 2017 Jul 26, 2017 - 05:24 PM GMTBy: Clive_Maund
 Technical analyst Clive Maund charts the U.S. dollar and expects it to trade sideways for a while before continuing its downward trend.
Because the dollar has such an important bearing on everything, especially the Precious Metals, it is timely for us to take a close look at it here after its recent steep drop, for as some of you may have seen, a number of indicators pertaining to the dollar suggest that, possibly after some further downside it is likely to bounce, or at least take a rest in a sideways range for a while, before the decline perhaps resumes in earnest.
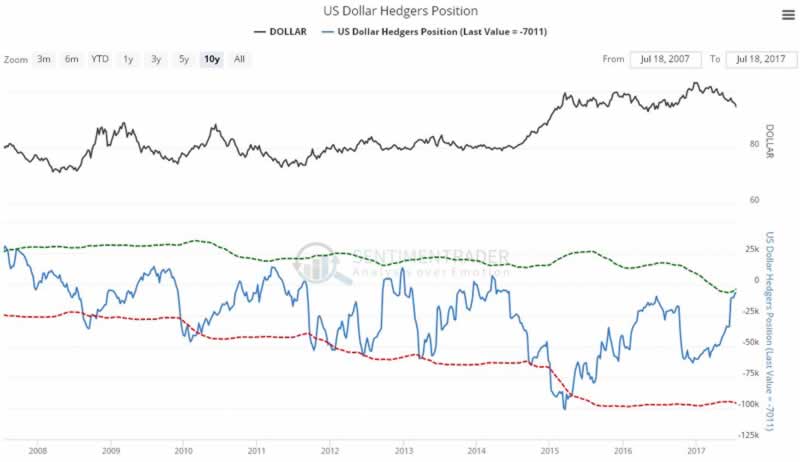
We'll start by looking at a couple of these indicators. The latest U.S. Dollar Hedgers chart, which is a form of COT chart, is certainly starting to look bullish, and until these positions ease somewhat, further significant downside for the dollar in the short-term looks unlikely.
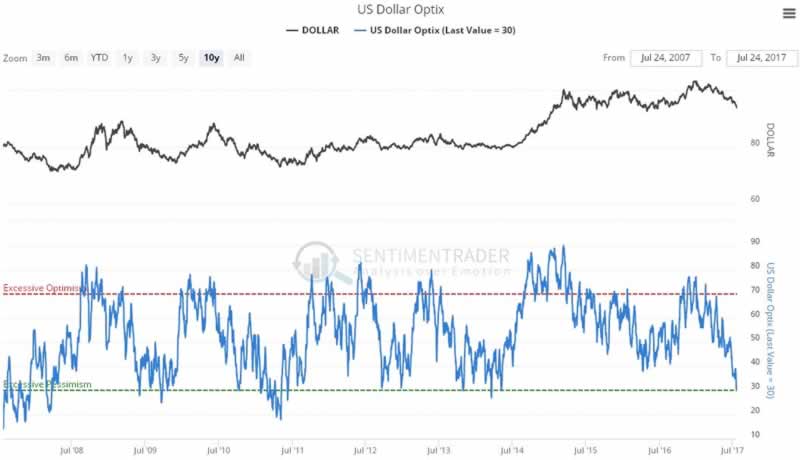
Meanwhile, the latest Dollar Optix, or optimism chart, also shows that pessimism is getting overdone. This doesn't necessarily mean that the dollar's downtrend is done, however, as minor rallies can cause this to ease before it then plumbs new lows. These two indicators taken together suggest that a relief rally is likely in the dollar soon, perhaps after it drops a bit lower first, although they don't mean that the rally will get very far.
Alright, so how does this square with our stated super bullish position on the Precious Metals, gold and silver? Well, it doesn't, of course, since a dollar rally normally means that gold and silver will drop back. So what's going on here? The latest COTs for gold and silver were super bullish, especially silver, which was even more bullish than late 2015, and the key point to make here is that they remain so, regardless of any other considerations or what is going on elsewhere. This being so it means one of two things—either the dollar and gold and silver are going to rally in unison, unlikely but possible, or after some kind of relief rally or consolidation pattern, the dollar's decline will resume, perhaps with a vengeance, and as we will see it could possibly accelerate into a crash.
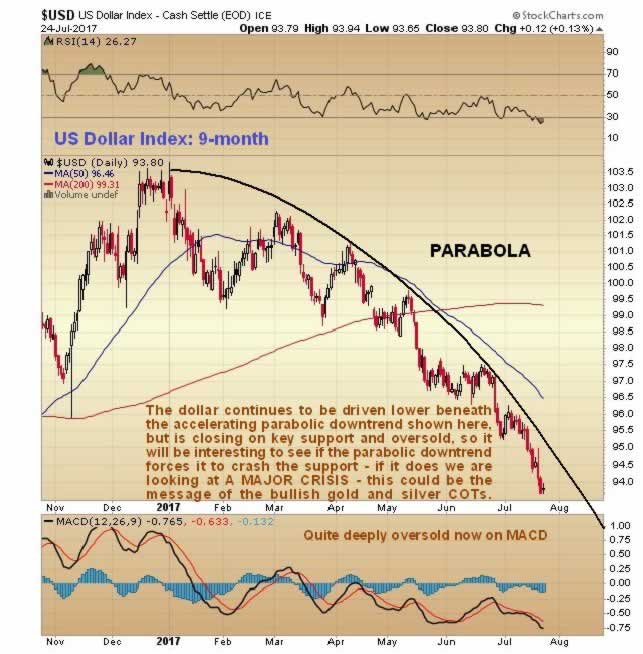
Turning now to the charts for the dollar itself, we start by looking at its latest 9-month chart. As we had already figured out a month or two ago, it is being forced lower at an accelerating pace by a parabolic downtrend. Now we are arriving at a critical juncture above key support with the key indicators above suggesting a bounce or a pause in the decline. However, should the parabola force a breakdown below the support, a really severe decline or crash will be in prospect.
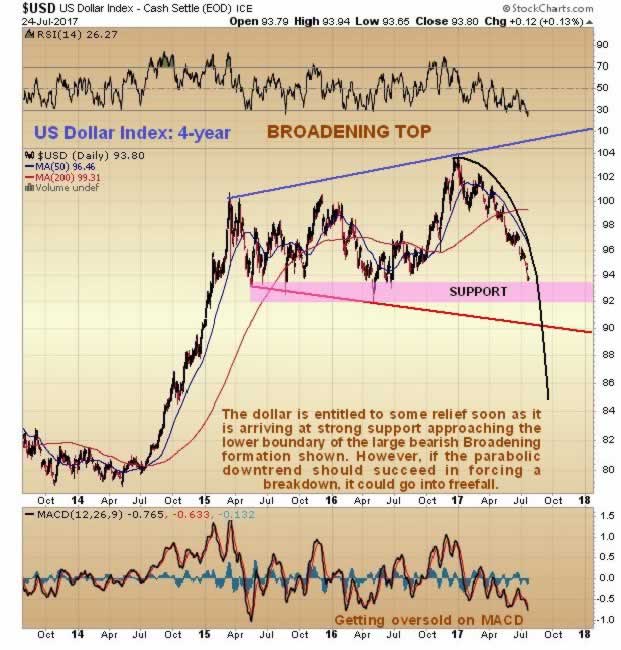
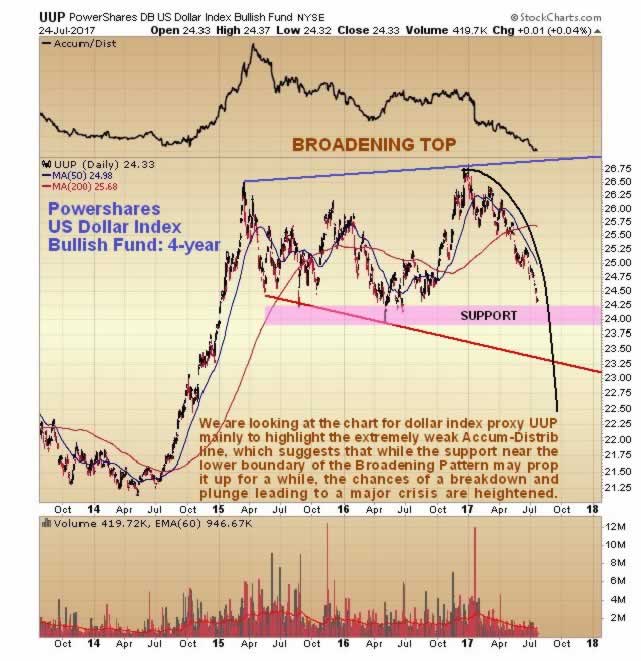
On the 4-year chart we can see how the parabolic downtrend has forced the dollar down towards the key support approaching the lower boundary of a large bearish Broadening Formation. While several indicators are suggesting that it will take at least a breather here, if it does break down the consequences for the dollar are likely to be dire—and this could be the message of the super bullish gold and silver COTs.
It's also useful to look at the 4-year chart for dollar proxy, the PowerShares US Dollar Index Bullish Fund, which looks about the same as the dollar index chart, except that we can also look at volume and volume indicators. The Accum-Distrib line in particular is extremely weak, and gives us an additional clue that the dollar may be in the early stages of a really serious decline. Again, this could explain the strongly bullish gold and silver COTs.
Actually, it's not hard to understand why the dollar could crash soon. Those in control of the U.S. have been struggling to maintain the U.S. dollar's supremacy as the global reserve currency for years, which has involved the maintenance of a massive military machine spanning the world, with hundreds of overseas military bases designed to project power and impose dominance. Those who have dared to challenge the dollar's hegemony, by attempting to trade in other currencies, like Qaddafi and Saddam Hussein, have been killed and their countries left in ruins. Now the rising Eastern powers like China are threatening the hegemony of the dollar, but they can't be attacked because they have nukes and can strike back. Russia has nukes too and so can't be attacked physically, except perhaps by means of a "1st strike" and its parallel drive to escape dollar hegemony is the reason that it has instead come under economic assault via an artificially low oil price and sanctions, and why the democratically elected government of the Ukraine was overthrown by heavily bankrolled neo-Nazis to install a pro-U.S., anti-Russian puppet government.
The point to grasp in all this is that, to put it crudely, the U.S. has managed to "piss off" most of the world, with its heavy handed approach to maintaining dollar dominance using military force when it can get away with it, the only countries pleased with its efforts being Israel, sidekick countries like Poland and the UK, and client States like Saudi Arabia, who are in for a big shock when they discover, after Iran has been dealt with, that they are no longer important. The East is playing a carefully calculated game to rid itself of dollar dominance, and those of you who have read "The Art of War" will know that they are not to be underestimated—thus the continued US threat of using brute force, exemplified by the extremely provocative and thuggish NATO military exercises hard up against the Russian border in Latvia and Poland, etc. that took place not too long ago, will be blunted and turned against it. What is likely to happen is that the East will gradually circumvent the dollar until the U.S. economy collapses, no longer able to afford the huge burdens of its massive debts, welfare state and the military drain. This makes the situation very dangerous, because the U.S. will be tempted to use force to maintain its dominance while it can still afford to.
Finally, we will take a quick look at the very long-term 20-year chart for the dollar index. This chart makes plain that if the dollar has peaked, and is soon to enter a severe decline, it won’t be the 1st time in the past two decades, as between 2002 and 2008 it suffered a massive drop—and that was long before it was threatened with being delisted as the global reserve currency. This chart also shows that it could drop a long, long way from the bearish looking Broadening Top that may now be approaching completion.
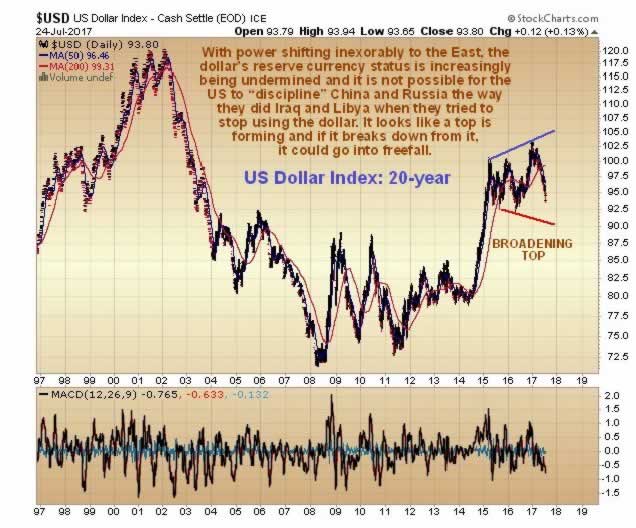
Conclusion: the latest extremely bullish COT charts are not negated by the dollar being oversold here and some of its indicators looking positive. The bigger picture is that the dollar may be headed for a breakdown and severe decline or even a crash.
Clive Maund has been president of www.clivemaund.com, a successful resource sector website, since its inception in 2003. He has 30 years' experience in technical analysis and has worked for banks, commodity brokers and stockbrokers in the City of London. He holds a Diploma in Technical Analysis from the UK Society of Technical Analysts.
Want to read more Gold Report articles like this? Sign up for our free e-newsletter, and you'll learn when new articles have been published. To see recent articles with industry analysts and commentators, visit our Streetwise Interviews page.
Disclosure:
1) Statements and opinions expressed are the opinions of Clive Maund and not of Streetwise Reports or its officers. Clive Maund is wholly responsible for the validity of the statements. Streetwise Reports was not involved in the content preparation. Clive Maund was not paid by Streetwise Reports LLC for this article. Streetwise Reports was not paid by the author to publish or syndicate this article.
2) This article does not constitute investment advice. Each reader is encouraged to consult with his or her individual financial professional and any action a reader takes as a result of information presented here is his or her own responsibility. By opening this page, each reader accepts and agrees to Streetwise Reports' terms of use and full legal disclaimer. This article is not a solicitation for investment. Streetwise Reports does not render general or specific investment advice and the information on Streetwise Reports should not be considered a recommendation to buy or sell any security. Streetwise Reports does not endorse or recommend the business, products, services or securities of any company mentioned on Streetwise Reports.
Charts courtesy of Clive Maund.
© 2005-2022 http://www.MarketOracle.co.uk - The Market Oracle is a FREE Daily Financial Markets Analysis & Forecasting online publication.


