Most Popular
1. It’s a New Macro, the Gold Market Knows It, But Dead Men Walking Do Not (yet)- Gary_Tanashian
2.Stock Market Presidential Election Cycle Seasonal Trend Analysis - Nadeem_Walayat
3. Bitcoin S&P Pattern - Nadeem_Walayat
4.Nvidia Blow Off Top - Flying High like the Phoenix too Close to the Sun - Nadeem_Walayat
4.U.S. financial market’s “Weimar phase” impact to your fiat and digital assets - Raymond_Matison
5. How to Profit from the Global Warming ClImate Change Mega Death Trend - Part1 - Nadeem_Walayat
7.Bitcoin Gravy Train Trend Forecast 2024 - - Nadeem_Walayat
8.The Bond Trade and Interest Rates - Nadeem_Walayat
9.It’s Easy to Scream Stocks Bubble! - Stephen_McBride
10.Fed’s Next Intertest Rate Move might not align with popular consensus - Richard_Mills
Last 7 days
Stocks Correct into Bitcoin Happy Thanks Halving - Earnings Season Buying Opps - 4th July 24
24 Hours Until Clown Rishi Sunak is Booted Out of Number 10 - UIK General Election 2024 - 4th July 24
Clown Rishi Delivers Tory Election Bloodbath, Labour 400+ Seat Landslide - 1st July 24
Bitcoin Happy Thanks Halving - Crypto's Exist Strategy - 30th June 24
Is a China-Taiwan Conflict Likely? Watch the Region's Stock Market Indexes - 30th June 24
Gold Mining Stocks Record Quarter - 30th June 24
Could Low PCE Inflation Take Gold to the Moon? - 30th June 24
UK General Election 2024 Result Forecast - 26th June 24
AI Stocks Portfolio Accumulate and Distribute - 26th June 24
Gold Stocks Reloading - 26th June 24
Gold Price Completely Unsurprising Reversal and Next Steps - 26th June 24
Inflation – How It Started And Where We Are Now - 26th June 24
Can Stock Market Bad Breadth Be Good? - 26th June 24
How to Capitalise on the Robots - 20th June 24
Bitcoin, Gold, and Copper Paint a Coherent Picture - 20th June 24
Why a Dow Stock Market Peak Will Boost Silver - 20th June 24
QI Group: Leading With Integrity and Impactful Initiatives - 20th June 24
Tesla Robo Taxis are Coming THIS YEAR! - 16th June 24
Will NVDA Crash the Market? - 16th June 24
Inflation Is Dead! Or Is It? - 16th June 24
Investors Are Forever Blowing Bubbles - 16th June 24
Stock Market Investor Sentiment - 8th June 24
S&P 494 Stocks Then & Now - 8th June 24
As Stocks Bears Begin To Hibernate, It's Now Time To Worry About A Bear Market - 8th June 24
Gold, Silver and Crypto | How Charts Look Before US Dollar Meltdown - 8th June 24
Gold & Silver Get Slammed on Positive Economic Reports - 8th June 24
Gold Summer Doldrums - 8th June 24
S&P USD Correction - 7th June 24
Israel's Smoke and Mirrors Fake War on Gaza - 7th June 24
US Banking Crisis 2024 That No One Is Paying Attention To - 7th June 24
The Fed Leads and the Market Follows? It's a Big Fat MYTH - 7th June 24
How Much Gold Is There In the World? - 7th June 24
Is There a Financial Crisis Bubbling Under the Surface? - 7th June 24

Market Oracle FREE Newsletter

How to Protect your Wealth by Investing in AI Tech Stocks

GBPUSD Broke Above Channel Resistance

Currencies / British Pound Aug 01, 2017 - 03:33 PM GMT

By: Franco_Shao

Currencies

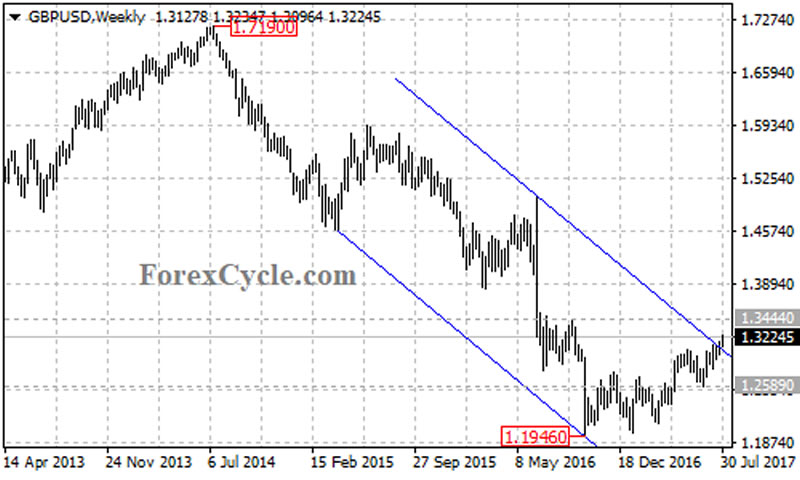
GBPUSD broke above the descending price channel at 1.3100 on its weekly chart, indicating that lengthier correction for the long term downtrend from the July 2014 high of 1.7190 is needed.


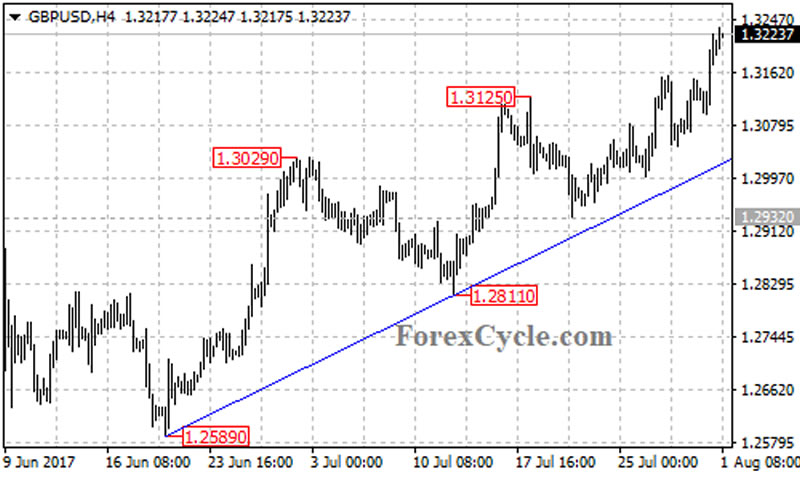
On the 4-hour chart, the GBPUSD pair stays above the bullish trend line from 1.2589 to 1.2811, with support at around 1.3015. As long as the trend line support holds, the upside movement could be expected to continue and next target would be at 1.3444, followed by 1.3700.


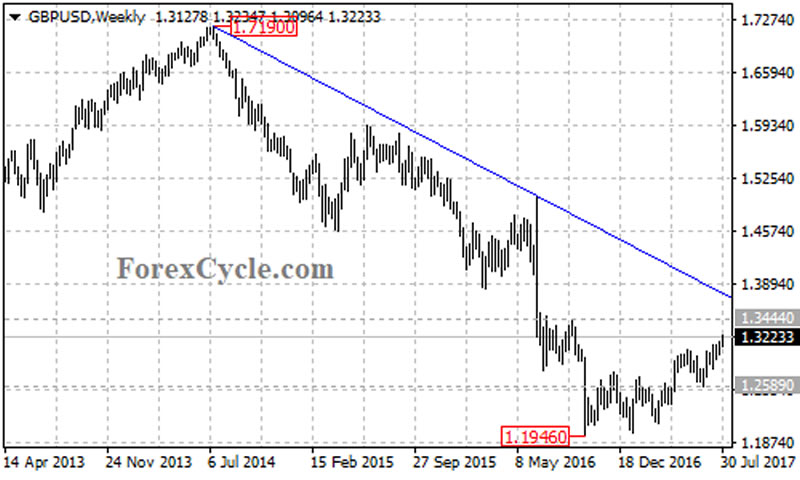
However, the price action from the October 2016 low of 1.1946 would possibly be correction of the long term downtrend. There is another long term bearish trend line on the weekly chart, with resistance now at around 1.3700. This would be the final target for the correction rebound. Reversal could be expected after touching this trend line resistance.


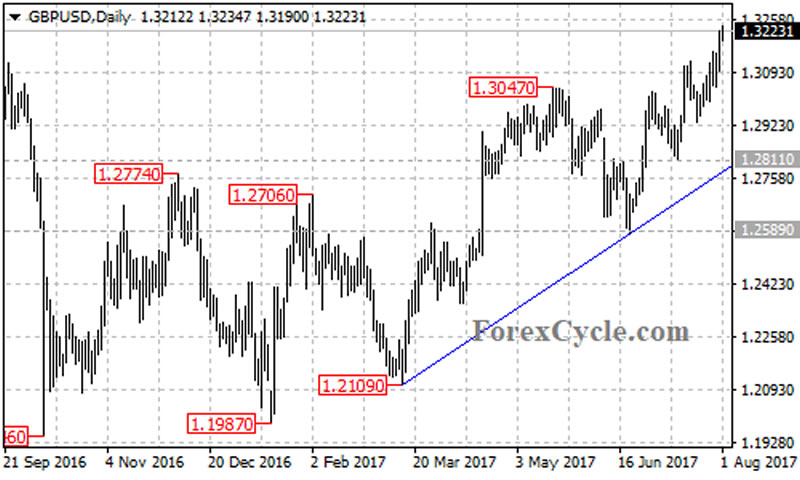
On the downside, a clear break below the trend line on the 4-hour chart could bring price back to next support level at 1.2932, followed by 1.2811. The 1.2811 level could be treated as the key support for the upside movement from the January 16 low of 1.1987, below this level could signal completion of the uptrend, then the following downside movement could bring price to retest 1.1946 support.


Technical levels

Support levels: 1.3015 (the bullish trend line on the 4-hour chart), 1.2932 (the July 20 low), 1.2811 (the key support), 1.2589 (the June 21 low), 1.2109 (the March 14 low), 1.1946 (the October 2016 low).

Resistance levels: 1.3444 (the September 2016 high), 1.3700 (the trend line on the weekly chart).

This article is written by Franco Shao, a senior analyst at ForexCycle.

© 2017 Copyright Franco Shao - All Rights Reserved Disclaimer: The above is a matter of opinion provided for general information purposes only and is not intended as investment advice. Information and analysis above are derived from sources and utilising methods believed to be reliable, but we cannot accept responsibility for any losses you may incur as a result of this analysis. Individuals should consult with their personal financial advisors.


© 2005-2022 http://www.MarketOracle.co.uk - The Market Oracle is a FREE Daily Financial Markets Analysis & Forecasting online publication.


Post Comment

Only logged in users are allowed to post comments. Register/ Log in