Most Popular
1. It’s a New Macro, the Gold Market Knows It, But Dead Men Walking Do Not (yet)- Gary_Tanashian
2.Stock Market Presidential Election Cycle Seasonal Trend Analysis - Nadeem_Walayat
3. Bitcoin S&P Pattern - Nadeem_Walayat
4.Nvidia Blow Off Top - Flying High like the Phoenix too Close to the Sun - Nadeem_Walayat
4.U.S. financial market’s “Weimar phase” impact to your fiat and digital assets - Raymond_Matison
5. How to Profit from the Global Warming ClImate Change Mega Death Trend - Part1 - Nadeem_Walayat
7.Bitcoin Gravy Train Trend Forecast 2024 - - Nadeem_Walayat
8.The Bond Trade and Interest Rates - Nadeem_Walayat
9.It’s Easy to Scream Stocks Bubble! - Stephen_McBride
10.Fed’s Next Intertest Rate Move might not align with popular consensus - Richard_Mills
Last 7 days
All Measures to Combat Global Warming Are Smoke and Mirrors! - 18th Apr 24
Cisco Then vs. Nvidia Now - 18th Apr 24
Is the Biden Administration Trying To Destroy the Dollar? - 18th Apr 24
S&P Stock Market Trend Forecast to Dec 2024 - 16th Apr 24
No Deposit Bonuses: Boost Your Finances - 16th Apr 24
Global Warming ClImate Change Mega Death Trend - 8th Apr 24
Gold Is Rallying Again, But Silver Could Get REALLY Interesting - 8th Apr 24
Media Elite Belittle Inflation Struggles of Ordinary Americans - 8th Apr 24
Profit from the Roaring AI 2020's Tech Stocks Economic Boom - 8th Apr 24
Stock Market Election Year Five Nights at Freddy's - 7th Apr 24
It’s a New Macro, the Gold Market Knows It, But Dead Men Walking Do Not (yet)- 7th Apr 24
AI Revolution and NVDA: Why Tough Going May Be Ahead - 7th Apr 24
Hidden cost of US homeownership just saw its biggest spike in 5 years - 7th Apr 24
What Happens To Gold Price If The Fed Doesn’t Cut Rates? - 7th Apr 24
The Fed is becoming increasingly divided on interest rates - 7th Apr 24
The Evils of Paper Money Have no End - 7th Apr 24
Stock Market Presidential Election Cycle Seasonal Trend Analysis - 3rd Apr 24
Stock Market Presidential Election Cycle Seasonal Trend - 2nd Apr 24
Dow Stock Market Annual Percent Change Analysis 2024 - 2nd Apr 24
Bitcoin S&P Pattern - 31st Mar 24
S&P Stock Market Correlating Seasonal Swings - 31st Mar 24
S&P SEASONAL ANALYSIS - 31st Mar 24
Here's a Dirty Little Secret: Federal Reserve Monetary Policy Is Still Loose - 31st Mar 24
Tandem Chairman Paul Pester on Fintech, AI, and the Future of Banking in the UK - 31st Mar 24
Stock Market Volatility (VIX) - 25th Mar 24
Stock Market Investor Sentiment - 25th Mar 24
The Federal Reserve Didn't Do Anything But It Had Plenty to Say - 25th Mar 24

Market Oracle FREE Newsletter

How to Protect your Wealth by Investing in AI Tech Stocks

USDCAD Broke Below 1.2460 Support

Currencies / Canadian $ Aug 02, 2017 - 03:35 PM GMT

By: Franco_Shao

Currencies

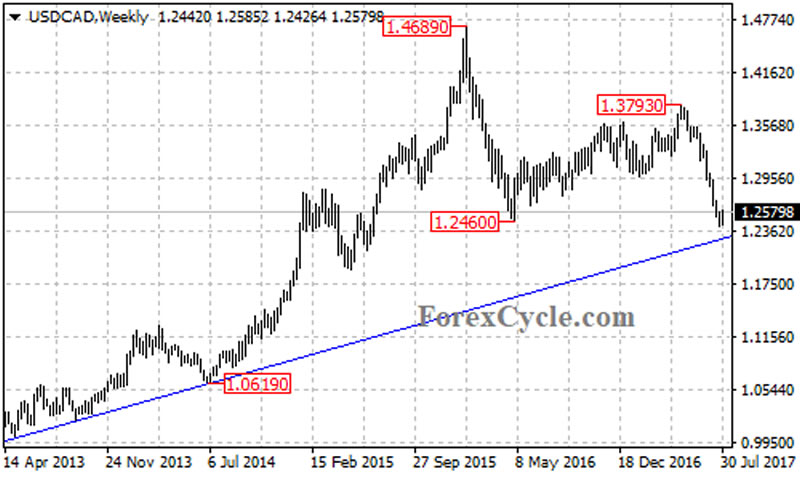
USDCAD recently broke below an important support level at the May 2016 low of 1.2460 and reached as low as 1.2413, confirming that the long term downtrend from the January 2016 high of 1.4689 had resumed.


On the downside

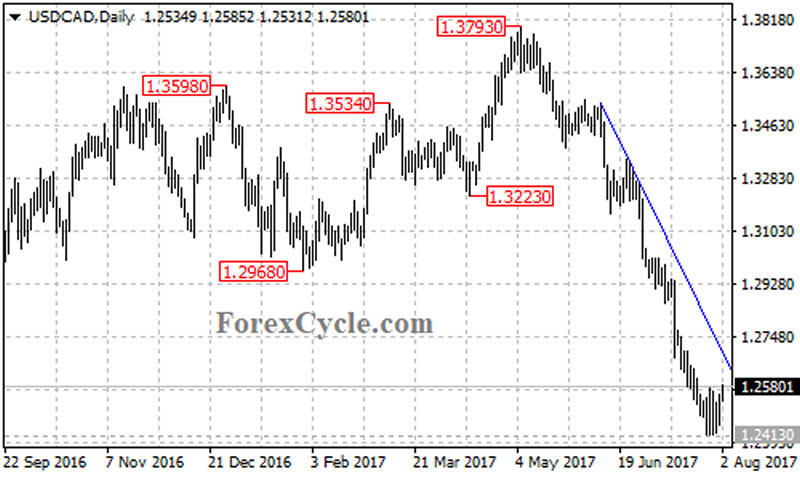
The USDCAD pair stays below a bearish trend line with resistance at around 1.2690 on its daily chart. As long as the price is below the trend line, the bearish movement from 1.3793 could be expected to continue and next target would be at around 1.2280.


There is a bullish support trend line from the September 2012 low of 0.9632 to the July 2014 low of 1.0619 on the weekly chart, with support now at 1.2280. A clear break below this trend line support could take price to the 50% retracement, taken from the July 2011 low of 0.9406 to 1.4689 at around 1.2050. The final target for this long term bearish movement would be at 1.1400 - 1.1600 area.

On the upside

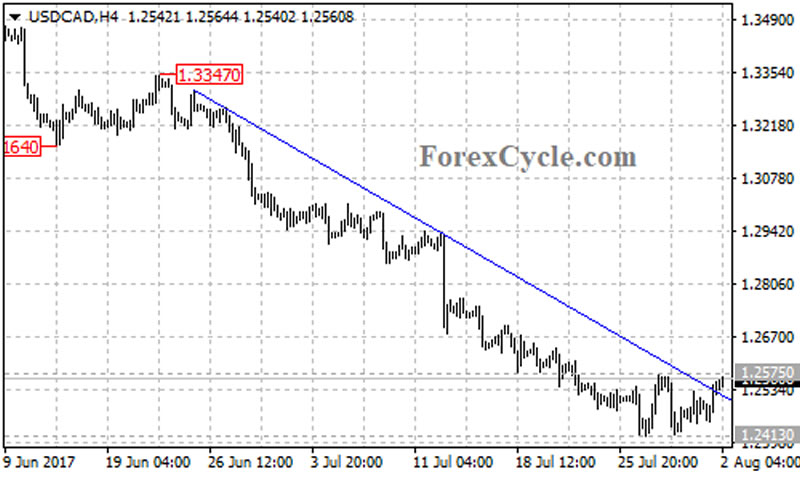
USDCAD broke above the bearish trend line on its 4-hour chart and is now facing 1.2575 resistance. A break above is level will indicate that a short term bottom has been formed at 1.2413, and the following correction rebound could bring price to test the resistance of the bearish trend line on the daily chart, followed by the 23.6% Fibonacci retracement taken from 1.3793 to 1.2413 at around 1.2740.


Technical levels

Support levels: 1.2280 (the ascending trend line on the weekly chart), 1.2050 (the 50% retracement).

Resistance levels: 1.2575, 1.2690 (the bearish trend line on the daily chart), 1.2740 (the 23.6% Fibonacci retracement).

This article is written by Franco Shao, a senior analyst at ForexCycle.

© 2017 Copyright Franco Shao - All Rights Reserved Disclaimer: The above is a matter of opinion provided for general information purposes only and is not intended as investment advice. Information and analysis above are derived from sources and utilising methods believed to be reliable, but we cannot accept responsibility for any losses you may incur as a result of this analysis. Individuals should consult with their personal financial advisors.


© 2005-2022 http://www.MarketOracle.co.uk - The Market Oracle is a FREE Daily Financial Markets Analysis & Forecasting online publication.


Post Comment

Only logged in users are allowed to post comments. Register/ Log in