


EURGBP Is Facing 0.9305 Resistance
Currencies / Euro Aug 28, 2017 - 10:40 AM GMTBy: Franco_Shao

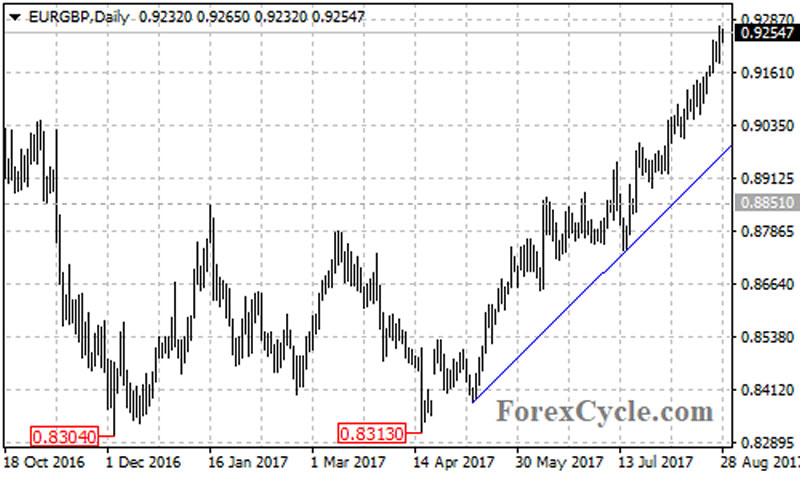
 EURGBP formed a double bottom pattern on its daily chart, with neckline at 0.8851 and measured move target at around 0.9400. After breaking above the neckline resistance, the pair extended its bullish movement to as high as 0.9270, facing the resistance at the October 2016 high of 0.9305.
The EURGBP pair stays in a bullish price channel on its 4-hour chart, with support at the bottom trend line now at around 0.9150, indicting that the price remains in the uptrend from 0.8891. As long as the channel support holds, the bullish move could be expected to continue and next target would be at 0.9305 previous high, followed by 0.9400 area.
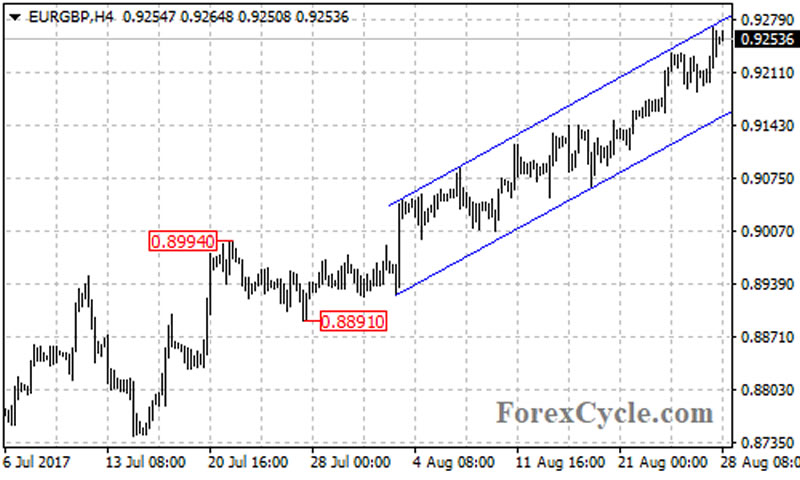
On the downside, a clear break below the bottom support trend line of the price channel on the 4-hour chart could take price back towards the bullish trend line on the daily chart now at 0.8970. Only a clear break below the trend line support could confirm that the upside movement from 0.8313 is compete, then the pair would find next support level at 0.8851.
The 0.8851 level is a resistance-turned-support which acted as the neckline of the double bottom pattern on the daily chart. If the price moves and settles below this level, the following downside movement could bring price into 0.8300 zone.
Technical levels
Support levels: 0.9150 (the bullish price channel on the 4-hour chart), 0.8970 (the bullish trend line on the daily chart), 0.8851 (the neckline of the double bottom pattern), 0.8304 (the December 2016 low).
Resistance levels: 0.9305 (the October 2016 high), 0.9400 (the measured move target).
This article is written by Franco Shao, a senior analyst at ForexCycle.
© 2017 Copyright Franco Shao - All Rights Reserved Disclaimer: The above is a matter of opinion provided for general information purposes only and is not intended as investment advice. Information and analysis above are derived from sources and utilising methods believed to be reliable, but we cannot accept responsibility for any losses you may incur as a result of this analysis. Individuals should consult with their personal financial advisors.
© 2005-2022 http://www.MarketOracle.co.uk - The Market Oracle is a FREE Daily Financial Markets Analysis & Forecasting online publication.