Most Popular
1. It’s a New Macro, the Gold Market Knows It, But Dead Men Walking Do Not (yet)- Gary_Tanashian
2.Stock Market Presidential Election Cycle Seasonal Trend Analysis - Nadeem_Walayat
3. Bitcoin S&P Pattern - Nadeem_Walayat
4.Nvidia Blow Off Top - Flying High like the Phoenix too Close to the Sun - Nadeem_Walayat
4.U.S. financial market’s “Weimar phase” impact to your fiat and digital assets - Raymond_Matison
5. How to Profit from the Global Warming ClImate Change Mega Death Trend - Part1 - Nadeem_Walayat
7.Bitcoin Gravy Train Trend Forecast 2024 - - Nadeem_Walayat
8.The Bond Trade and Interest Rates - Nadeem_Walayat
9.It’s Easy to Scream Stocks Bubble! - Stephen_McBride
10.Fed’s Next Intertest Rate Move might not align with popular consensus - Richard_Mills
Last 7 days
Friday Stock Market CRASH Following Israel Attack on Iranian Nuclear Facilities - 19th Apr 24
All Measures to Combat Global Warming Are Smoke and Mirrors! - 18th Apr 24
Cisco Then vs. Nvidia Now - 18th Apr 24
Is the Biden Administration Trying To Destroy the Dollar? - 18th Apr 24
S&P Stock Market Trend Forecast to Dec 2024 - 16th Apr 24
No Deposit Bonuses: Boost Your Finances - 16th Apr 24
Global Warming ClImate Change Mega Death Trend - 8th Apr 24
Gold Is Rallying Again, But Silver Could Get REALLY Interesting - 8th Apr 24
Media Elite Belittle Inflation Struggles of Ordinary Americans - 8th Apr 24
Profit from the Roaring AI 2020's Tech Stocks Economic Boom - 8th Apr 24
Stock Market Election Year Five Nights at Freddy's - 7th Apr 24
It’s a New Macro, the Gold Market Knows It, But Dead Men Walking Do Not (yet)- 7th Apr 24
AI Revolution and NVDA: Why Tough Going May Be Ahead - 7th Apr 24
Hidden cost of US homeownership just saw its biggest spike in 5 years - 7th Apr 24
What Happens To Gold Price If The Fed Doesn’t Cut Rates? - 7th Apr 24
The Fed is becoming increasingly divided on interest rates - 7th Apr 24
The Evils of Paper Money Have no End - 7th Apr 24
Stock Market Presidential Election Cycle Seasonal Trend Analysis - 3rd Apr 24
Stock Market Presidential Election Cycle Seasonal Trend - 2nd Apr 24
Dow Stock Market Annual Percent Change Analysis 2024 - 2nd Apr 24
Bitcoin S&P Pattern - 31st Mar 24
S&P Stock Market Correlating Seasonal Swings - 31st Mar 24
S&P SEASONAL ANALYSIS - 31st Mar 24
Here's a Dirty Little Secret: Federal Reserve Monetary Policy Is Still Loose - 31st Mar 24
Tandem Chairman Paul Pester on Fintech, AI, and the Future of Banking in the UK - 31st Mar 24
Stock Market Volatility (VIX) - 25th Mar 24
Stock Market Investor Sentiment - 25th Mar 24
The Federal Reserve Didn't Do Anything But It Had Plenty to Say - 25th Mar 24

Market Oracle FREE Newsletter

How to Protect your Wealth by Investing in AI Tech Stocks

NZDUSD’s Bearish Movement Extended To 0.6931

Currencies / Forex Trading Oct 24, 2017 - 12:00 PM GMT

By: Franco_Shao

Currencies

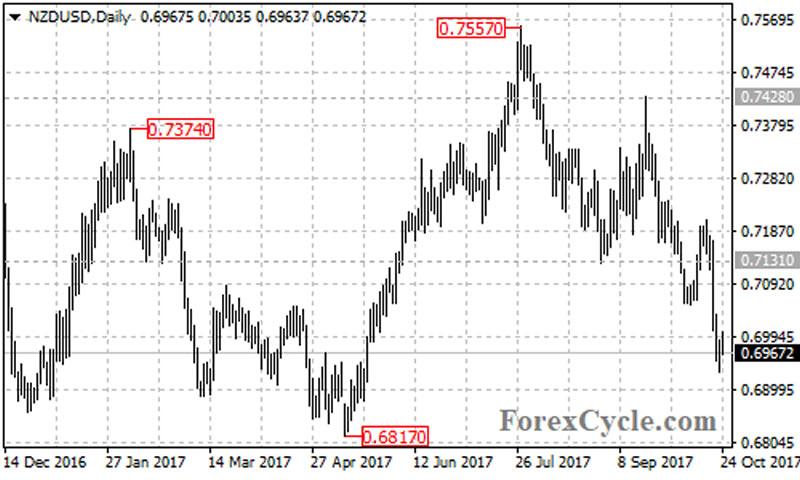
NZDUSD extended its downside movement from 0.7557 to as low as 0.6931. Further decline would likely be seen after a minor consolidation and next target would be at 0.6817.


On the 4-hour chart, the NZDUSD pair traded within a bearish price channel. The price just bounced off the bottom trend line, suggesting that consolidation of the downtrend is underway. Range trading between 0.6931 and 0.7035 is possible in the coming days.


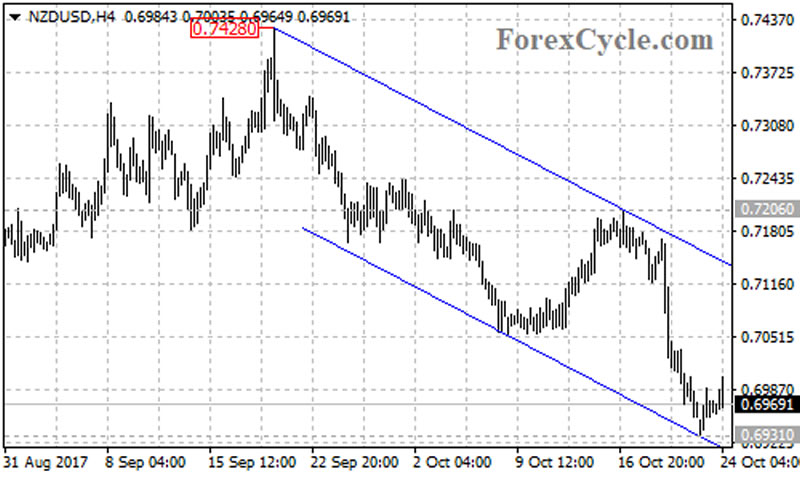
Near term resistance is at 0.7035, as long as this level holds, the downtrend could be expected to resume and a breakdown below 0.6931 support could trigger another bearish movement towards 0.6817. However, above 0.7035 resistance will indicate that lengthier consolidation for the downtrend is needed, then the pair will find resistance at the top trend line of the channel now at around 0.7140, followed by 0.7206.

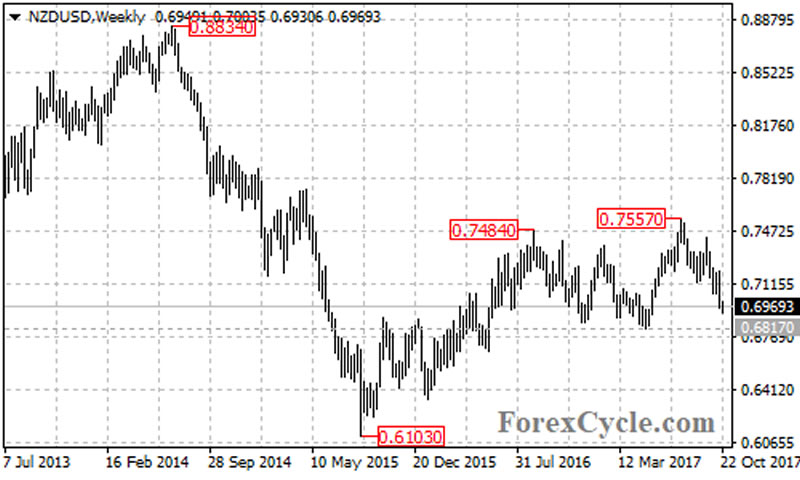
For long term analysis, the NZDUSD pair is facing an important support at 0.6817 which acts as a neckline of a double top pattern on the weekly chart. Below this level will confirm that a reversal pattern had been formed, then the measured move target would be at around 0.6100 area.


Technical levels

Support levels: 0.6931 (the October 23 low), 0.6817 (the May 11 low, the neckline of the double top pattern on the weekly chart).

Resistance levels: 0.7035 (near term resistance), 0.7140 (the top of the price channel on the 4-hour chart), 0.7206 (the October 17 high), 0.7428 (the September 20 high).

This article is written by Franco Shao, a senior analyst at ForexCycle.

© 2017 Copyright Franco Shao - All Rights Reserved Disclaimer: The above is a matter of opinion provided for general information purposes only and is not intended as investment advice. Information and analysis above are derived from sources and utilising methods believed to be reliable, but we cannot accept responsibility for any losses you may incur as a result of this analysis. Individuals should consult with their personal financial advisors.


© 2005-2022 http://www.MarketOracle.co.uk - The Market Oracle is a FREE Daily Financial Markets Analysis & Forecasting online publication.


Post Comment

Only logged in users are allowed to post comments. Register/ Log in