


Gold Price Moved In Price Channel On 4-hour Chart
Commodities / Gold and Silver 2017 Oct 31, 2017 - 03:57 PM GMTBy: Franco_Shao

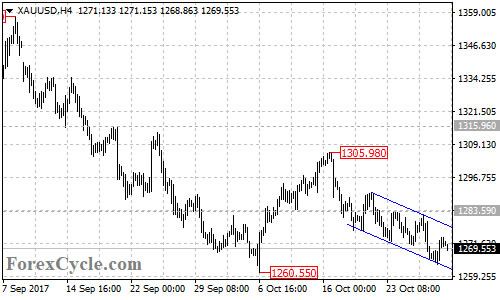
 XAUUSD moved within a bearish price channel on its 4-hour chart, indicating that the price remains in the downtrend from 1305.98. Near term resistance is at the top of the channel now at around 1278.50. As long as the channel resistance holds, the downside movement could be expected to continue and next target would be at 1260.55. A breakdown below this level could trigger further decline to 1250 area.
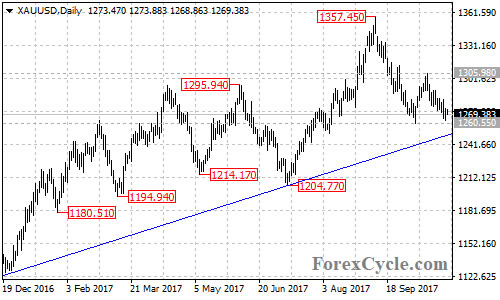
There is bullish support trend line from 1122.56 to 1204.77 on the daily chart, now at around 1250. As long as the gold price is above this trend line, the fall from 1357.45 could be treated as correction of the uptrend from 1122.56 and another rise towards 1400 is still possible after the correction. However, a clear break below this trend line will confirm that the uptrend had completed at 1357.45 already, then the gold price would find next support level at 1204.77.
On the upside, a clear break above the top of the price channel on the 4-hour chart could take price to next resistance level at 1283.59. A breakout of this level will indicate that the downside movement from 1305.98 is complete, then next target would be at 1305.98, followed by 1315.96.
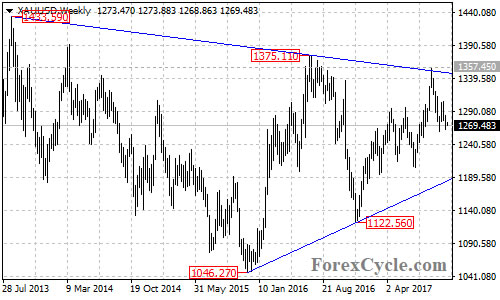
For long term analysis, the gold price seems to be forming a triangle pattern on the weekly chart and just bounced off the top trend line of the pattern at 1357.45. Further decline towards the bottom trend line from 1046.27 to 1122.56 now at 1183 would likely be seen over the next several weeks, and this would be the final target of the fall from 1357.45.
Technical levels
Support levels: 1260.55 (the October 6 low), 1250 (the bullish trend line on the daily chart), 1204.77 (the July 10 low), 1183 (the bottom trend line of the triangle pattern).
Resistance levels: 1278.50 (the top trend line of the price channel on the 4-hour chart), 1283.59 (the October 24 high), 1305.98 (the October 16 high), 1315.96 (the September 20 high), 1357.45 (the September 8 high), 1375.11 (the July 2016 high), 1400 (the important psychological level).
This article is written by Franco Shao, a senior analyst at ForexCycle.
© 2017 Copyright Franco Shao - All Rights Reserved Disclaimer: The above is a matter of opinion provided for general information purposes only and is not intended as investment advice. Information and analysis above are derived from sources and utilising methods believed to be reliable, but we cannot accept responsibility for any losses you may incur as a result of this analysis. Individuals should consult with their personal financial advisors.
© 2005-2022 http://www.MarketOracle.co.uk - The Market Oracle is a FREE Daily Financial Markets Analysis & Forecasting online publication.